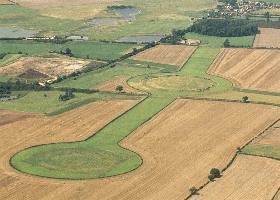
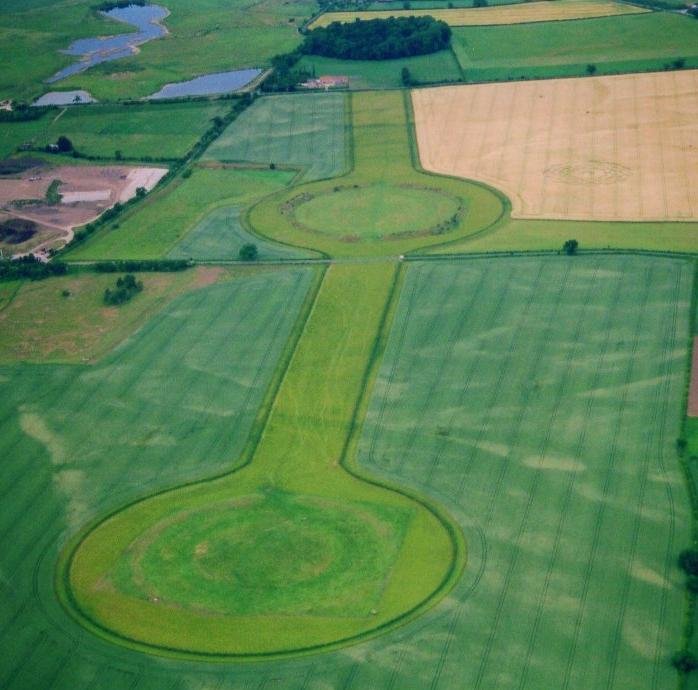
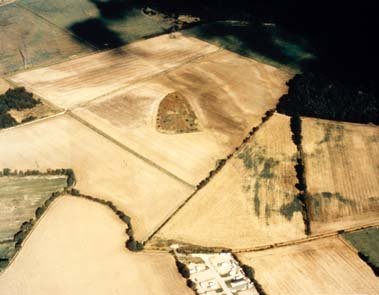
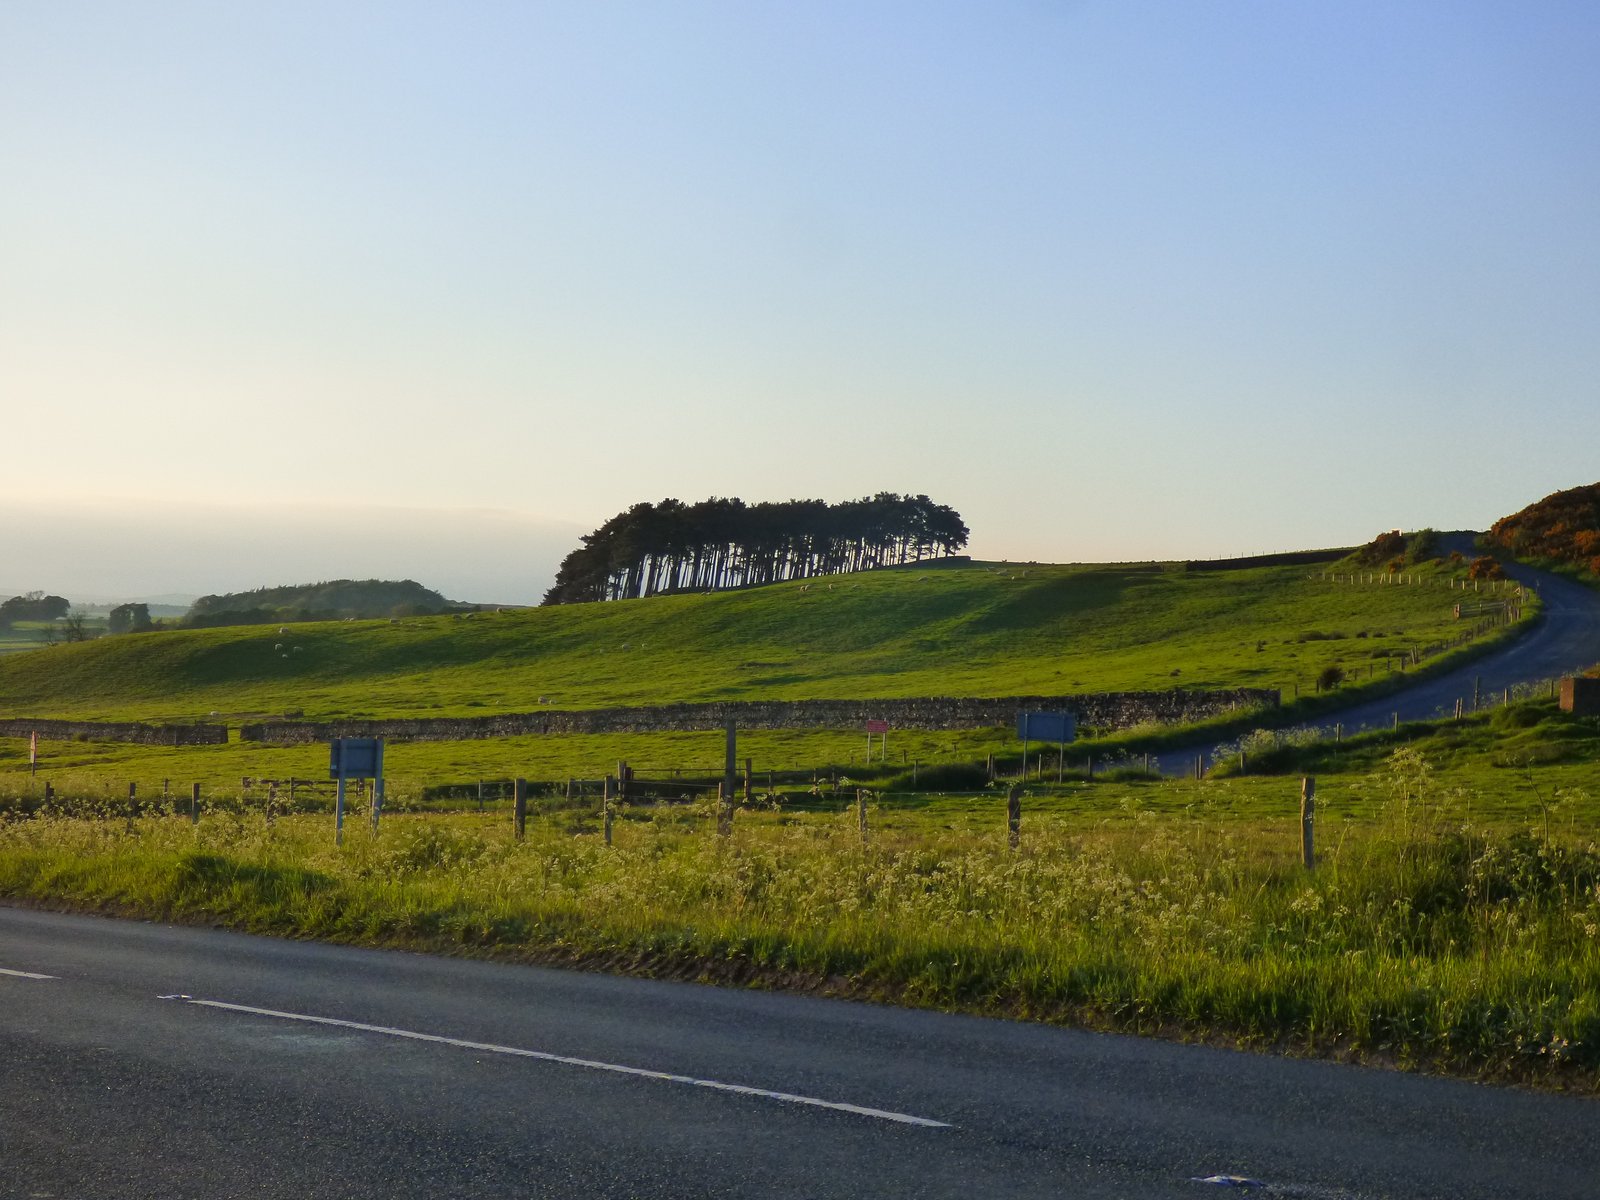
Thornborough Henges c.2004
Castle Hill, Almondbury
Castle Hill’s imposing silhouette hides a great prehistoric fort, Norman castle and Victorian tower. Thanks to Varley’s trenches and the Read more
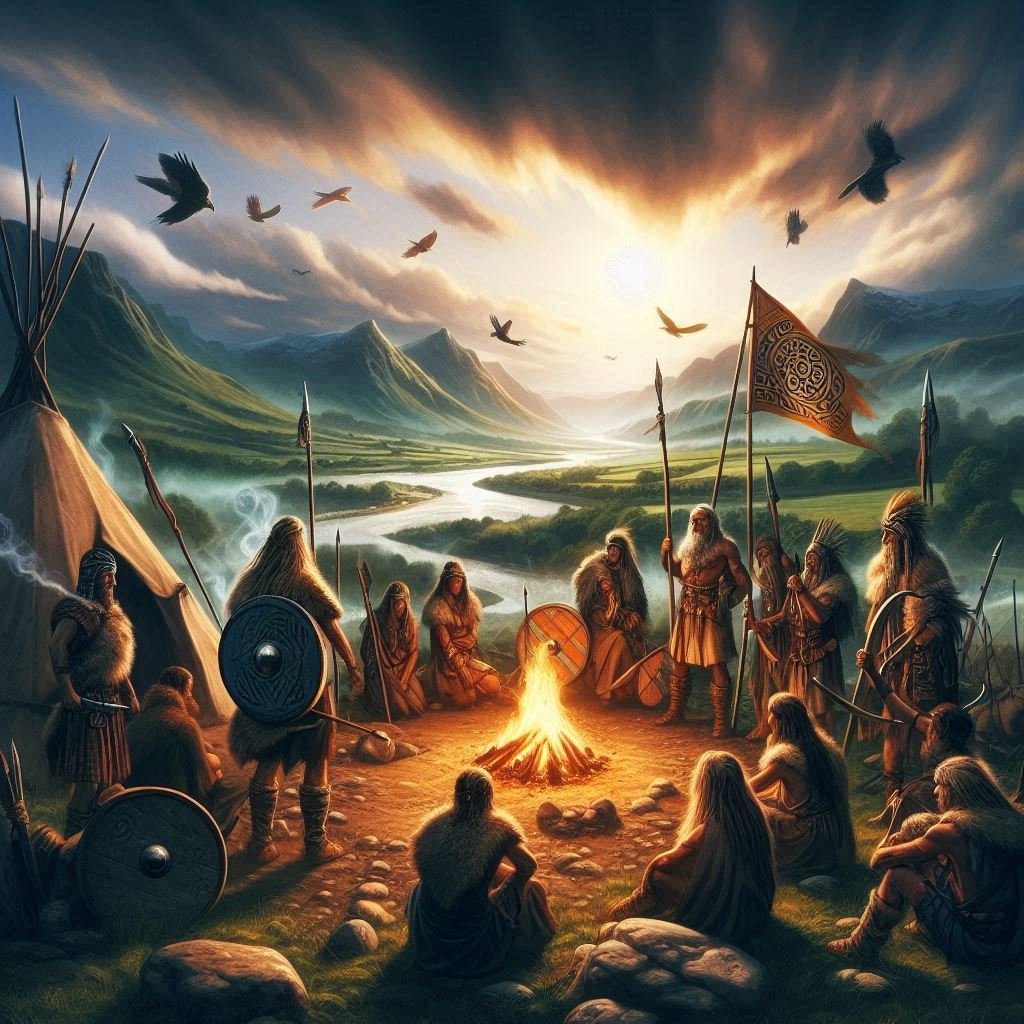
The Brigantes

Brigantes Map – Wikipedia
The name Brigantia represents three separate concepts: a goddess, a people, and a tribal federation. By the Roman period, the name represented a tribal federation compromising all of what would become the Roman province of Britannia Secunda, except for the Parisi territory, east of the River Derwent.
Before the arrival of the Romans, West Yorkshire and much of the Pennine uplands were occupied by a loose association of tribes known as the Brigantes. The name seems to mean ‘the high one’, which is a suitable epithet for a group of people living in the more mountainous regions of Britain. In East Yorkshire, their neighbours were another tribe called the Parisii, who appear to have had connections with the Seine valley. This accounts for the similarity of their name to that of the capital of modern France.

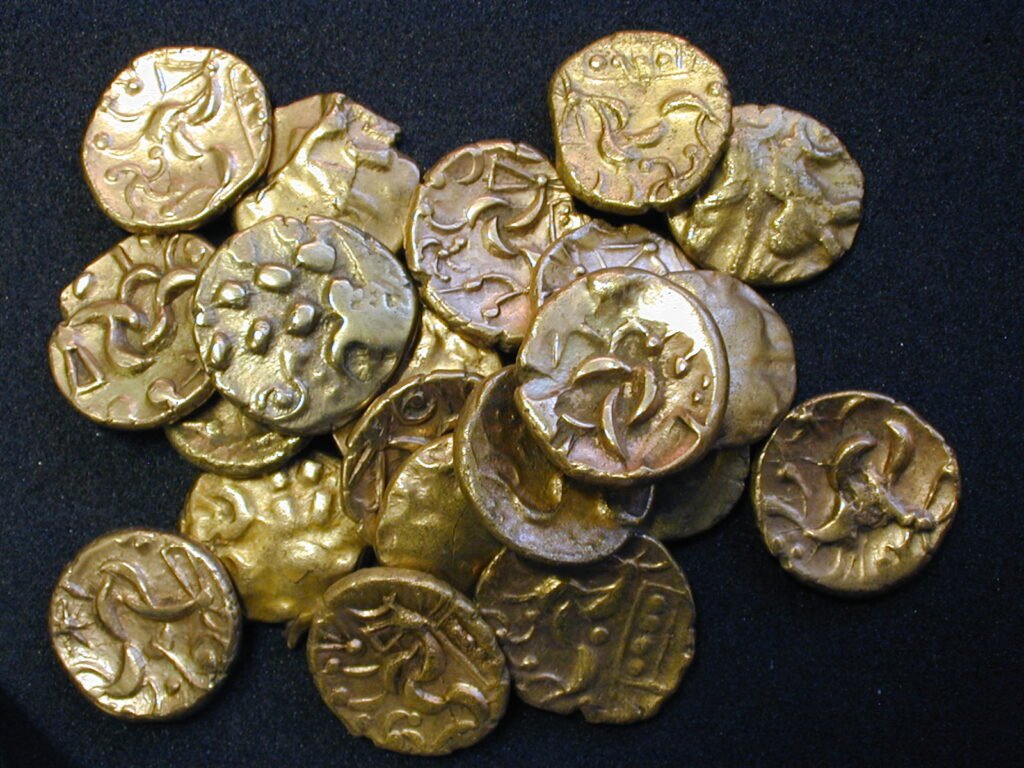
Stanwick Hoard – University of Warwick
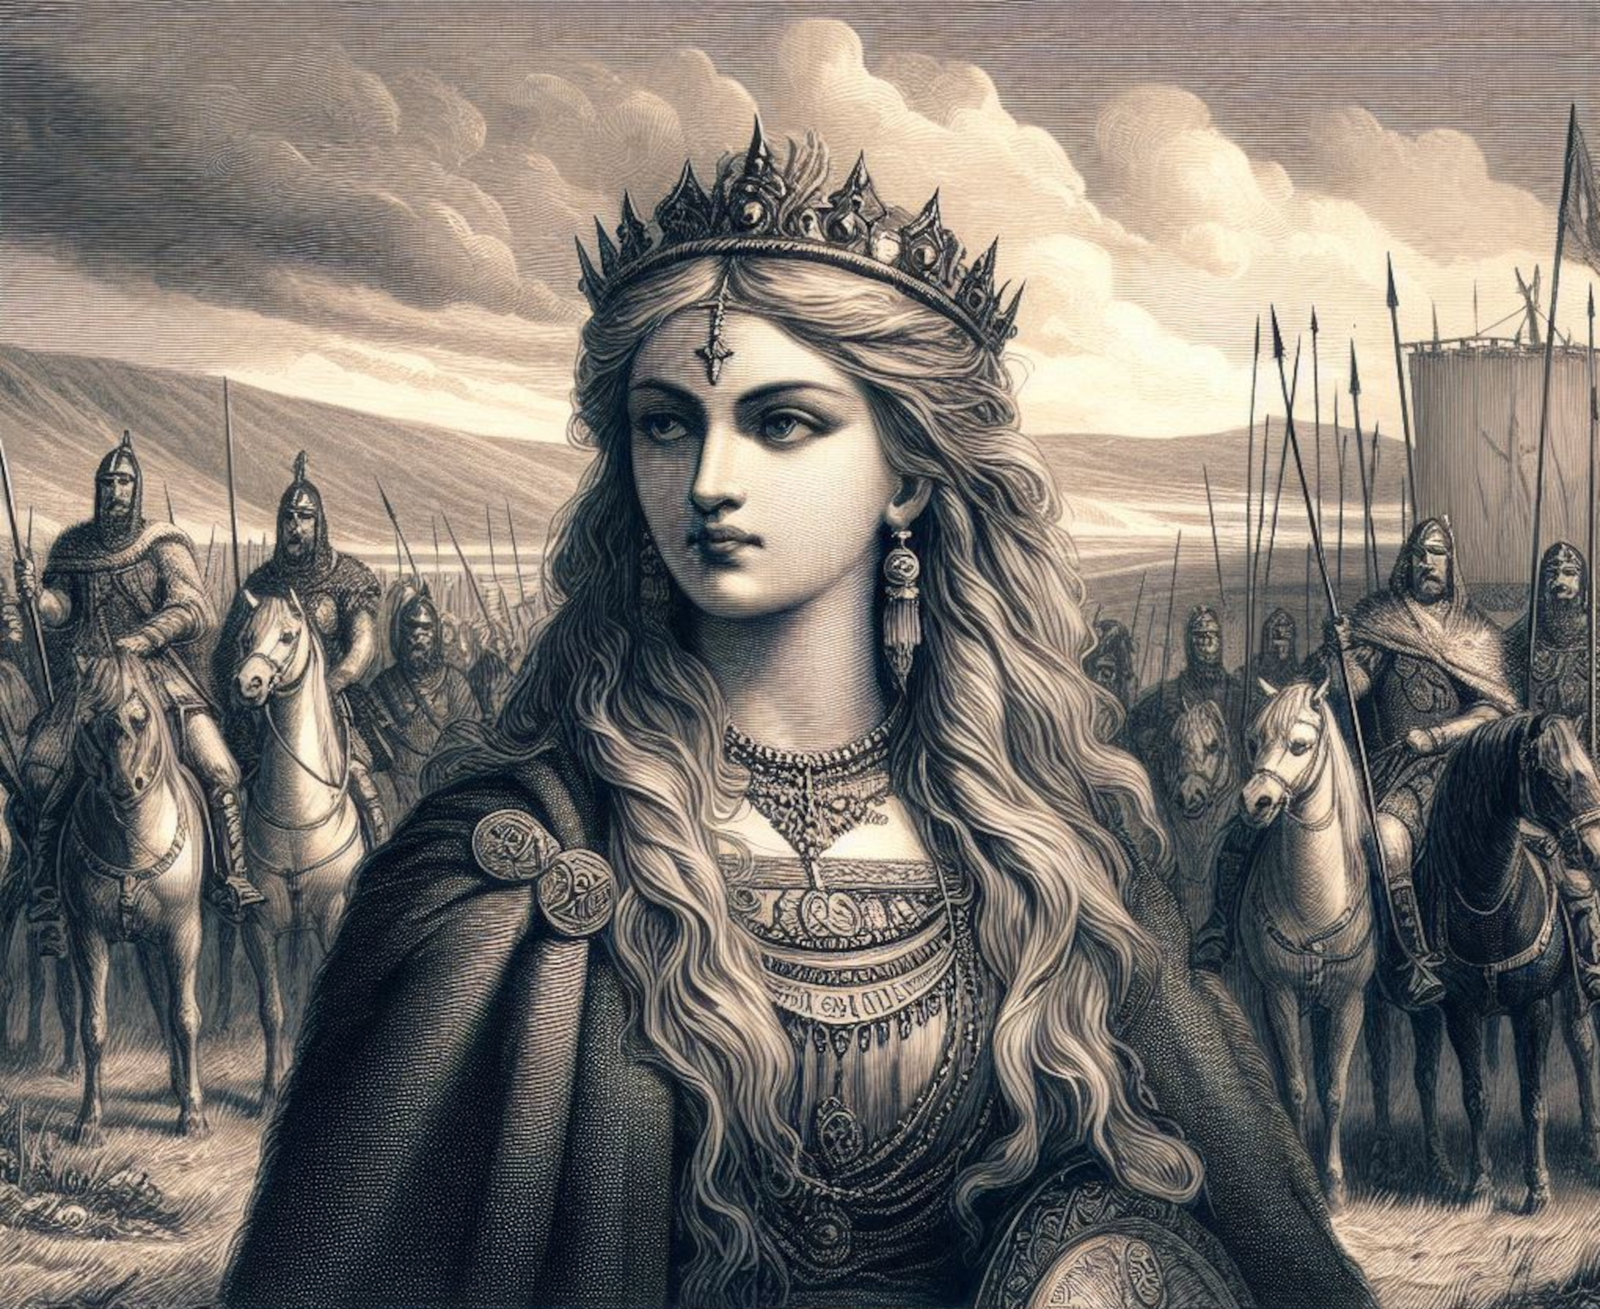
Historians know little about the Brigantes before the arrival of the Romans. Presumably their ruler at the time was one of those who surrendered to Claudius at Colchester in AD 43, but they are not mentioned by name. By the early 50s AD they were being ruled by Queen Cartimandua. She lost her control of the tribe in AD 69, following an uprising led by her ex-husband Venutius. The Romans put down the rebellion and then went on to conquer the rest of northern Britain.
During the post-Roman period, the province of Britannia Secunda reverted to a state more reminiscent of its pre-Roman tribal society. The civitas of the Parisi quickly became the kingdom of Deira. Rheged appears to have been formed from the civitas of the Carvetii. The Civitas Brigantium became divided into the regions or kingdoms of Elmet, Craven, and perhaps Brigantia, located on an axis from York to Catterick, plus probably others whose names have not survived. The original capital of Brigantia is unknown, Aldborough/Isurium Brigantia became the capital during the Venutius war, civitas capital of the Brigantes was then relocated to Eboracum (York) during the Roman consolidation of their northern territories.
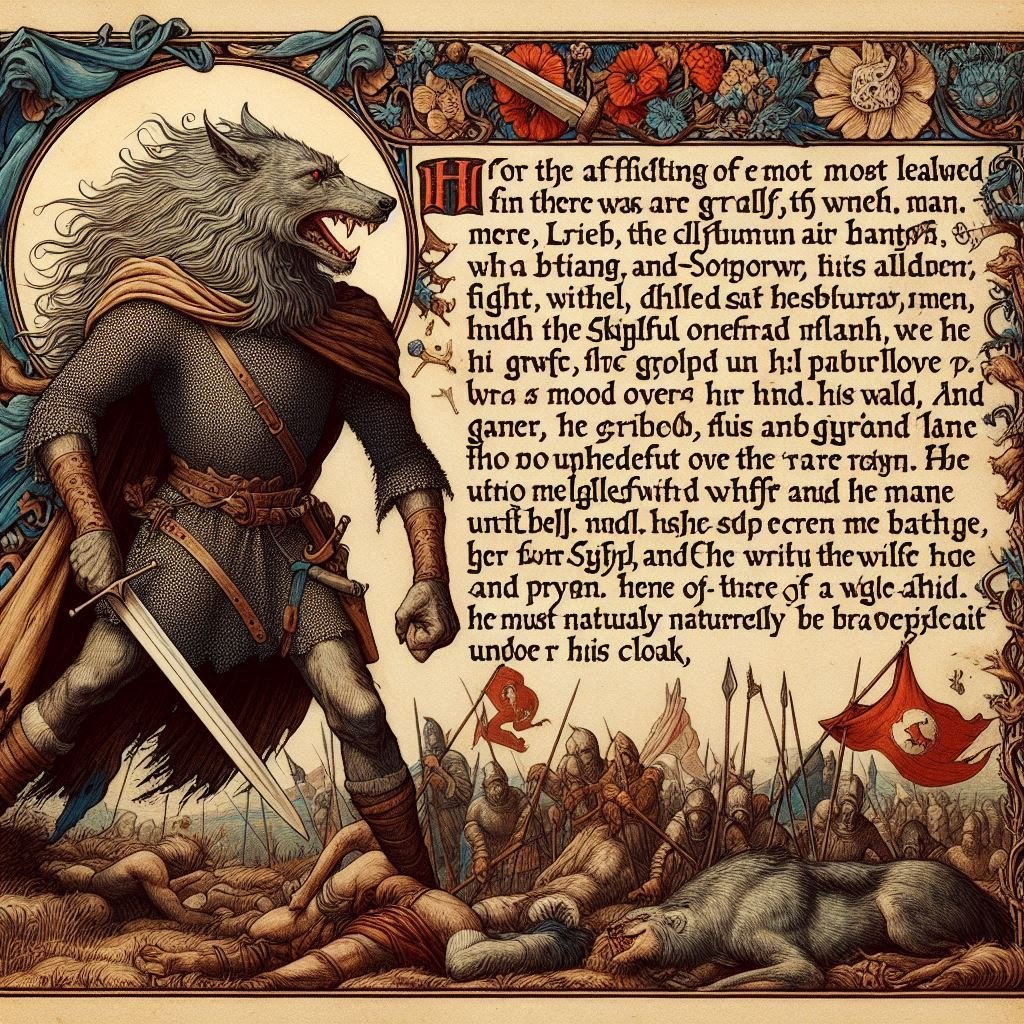
The term Brigantia and the concept of the goddess Brigantia survived into the post-Roman period. John Koch has tentatively translated two stanzas of the poem Y Gododdin to read “as [?] Brigantia rose, ascending towards the sky” (A.58) and “the man who [?]went down into [?] Brigantia was slain on a spear Shaft” (A.71) (Koch 1997:107, 113). Catterick, the site of the main action in Y Gododdin, was deep in pre-Roman Brigantian territory.
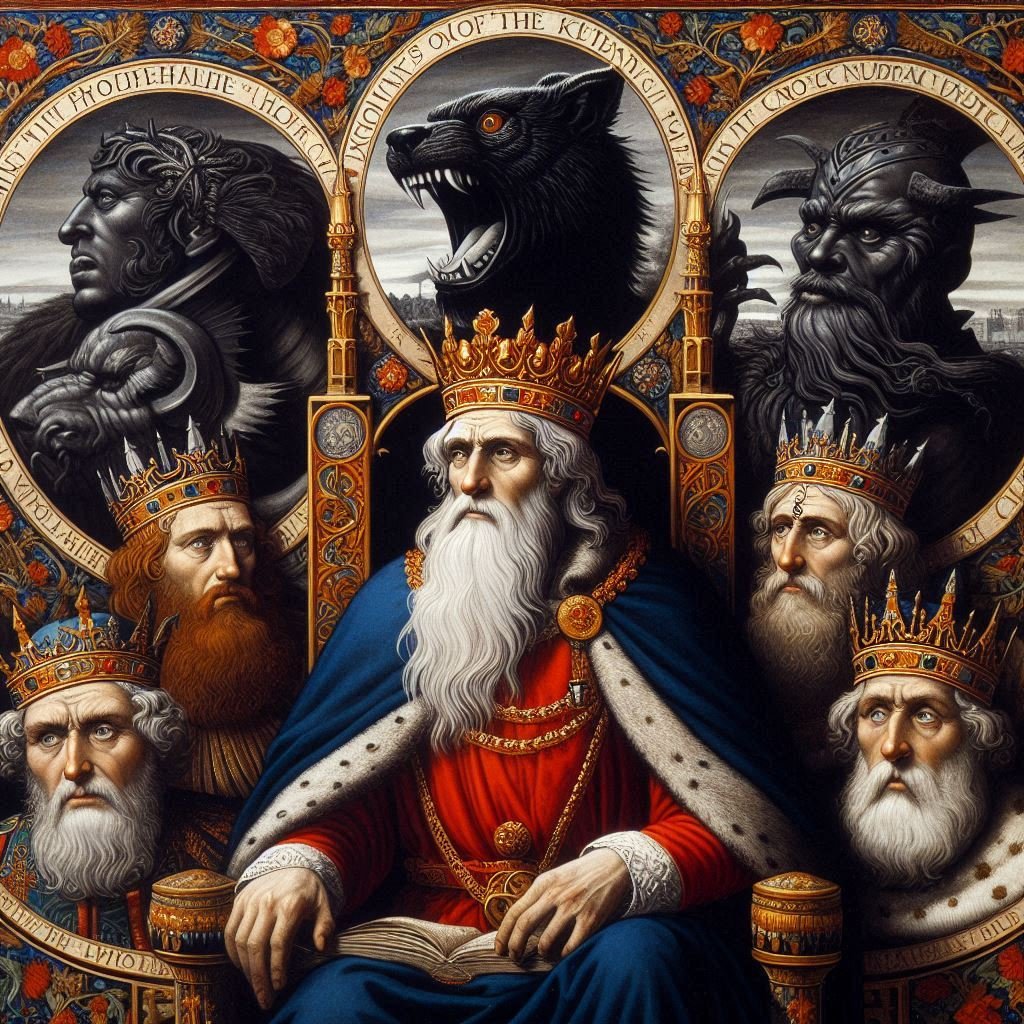
Brigantia was a goddess who manifested herself under three forms. If we can take her later manifestation in Ireland as a guide, Cormac’s Glossary tells us Brigantia represented first and foremost sovereignty, with her other two aspects representing healing and metal working (Byrne 1973; Ross 1996:456). Anne Ross further identifies Brigantia as a patroness of pastoral peoples in Ireland and Britain. The advent of Christianity did not abolish the role of Brigantia as a symbol of sovereignty. According to John Koch, “a further survival of this idea is seen in the fragmentary elegy to the 7th century Welsh king Cadwallon in which the River Braint (<*Briganti) is described as overflowing in grief for its fallen consort”.
All of the known post-Roman northern leaders located within the former territory of the Brigantian federation are found within the dynasty of Coel Hen the Protector. This creation of this super-dynasty may indicate that regions as far separate as Rheged in Cumbria and Elmet in south-eastern Brigantia were linked together in some sort of political union. This union could have taken several forms, from an actual federation with a supreme king to an alliance of tribes with a dominant king or alternatively, a succession of dominant kings exerting hegemony over the other kingdoms of the former province of Britannia Secunda. If the dynasty of Coel Hen can be seen to have been used by later scribes as a justification or rationalization for the reformation of the Brigantia polity, the localization of the Coeling dynasts suggests Brigantian territory extended beyond its limits under the Romans to include the Gododdin and part of Galloway.
Although fourth century Roman forts were abandoned all over Britain, Kenneth Dark observed “that out of at most 16 sites with later 5th-6th century evidence no fewer than 14 had probably been under the command of the Dux Britanniarum at the end of the 4th century” (Dark 1998). Not only were these sites reoccupied, they were refortified and Saxon mercenaries may have been recruited to man them, as mentioned in the Historia Brittonum (Dark 1992). The high status of these sites is illustrated by the British halls found in Birdoswald fortress (Dark 1992) and the fifth century Christian church found in the fortress of Vindolanda (Wilkinson 1998). Further occupation has been found at the two towns closest to the Wall, Carlisle and Corbridge, plus the other Brigantian towns of Catterick, Aldborough, York and Malton (Dark 1992). Placenames and Welsh tradition further specifically associate the Coelings with the Mote of Liddel, Papcastle (Derventio), and Catterick (Miller 1975). All of these sites are believed to be located within pre-Roman Brigantian territory.
In the fifth and sixth centuries, which have been called the Age of Arthur, the tribes of Greater Brigantia were indeed on their way to becoming a major power again. The combination of extensive fortification of the abandoned Roman sites and a dynasty that includes rulers located throughout the former Brigantian territory suggests that either the federation actually or functionally became reformed by alliance and/or hegemony. With the rebirth of Greater Brigantian independence, the pre-Roman past would have been recalled with pride and sorrow.
The native way of life
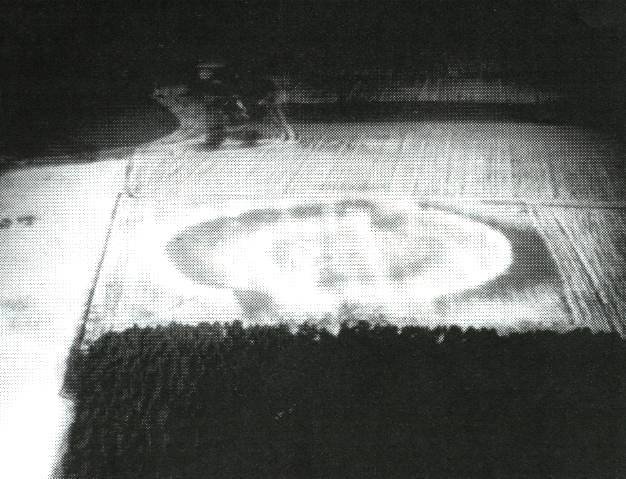
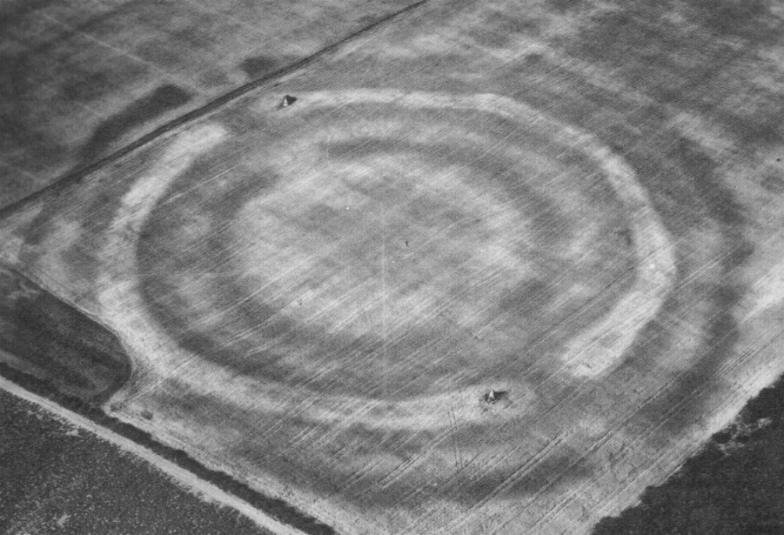
For many of the people of the region life must have changed little after the Roman occupation of Brigantia. Some settlements, such as Dalton Parlours near Wetherby, did develop into Roman style villas, but many seem to have continued in their old way of life throughout the Roman period. Many of these native farmstead sites can be recognised from cropmarks on agricultural land. Cropmarks are caused by the differing rates of growth between those plants which are over a buried ditch and whose roots can still get water long after the rest of the field has dried out. Such differences in colour can be seen and photographed from the air and plotted onto a map. This technique of aerial photography is especially useful on the Magnesian Limestone belt which lies to the east of Leeds, where archaeologists have identified dozens of traces of small farms and their lanes and fields.
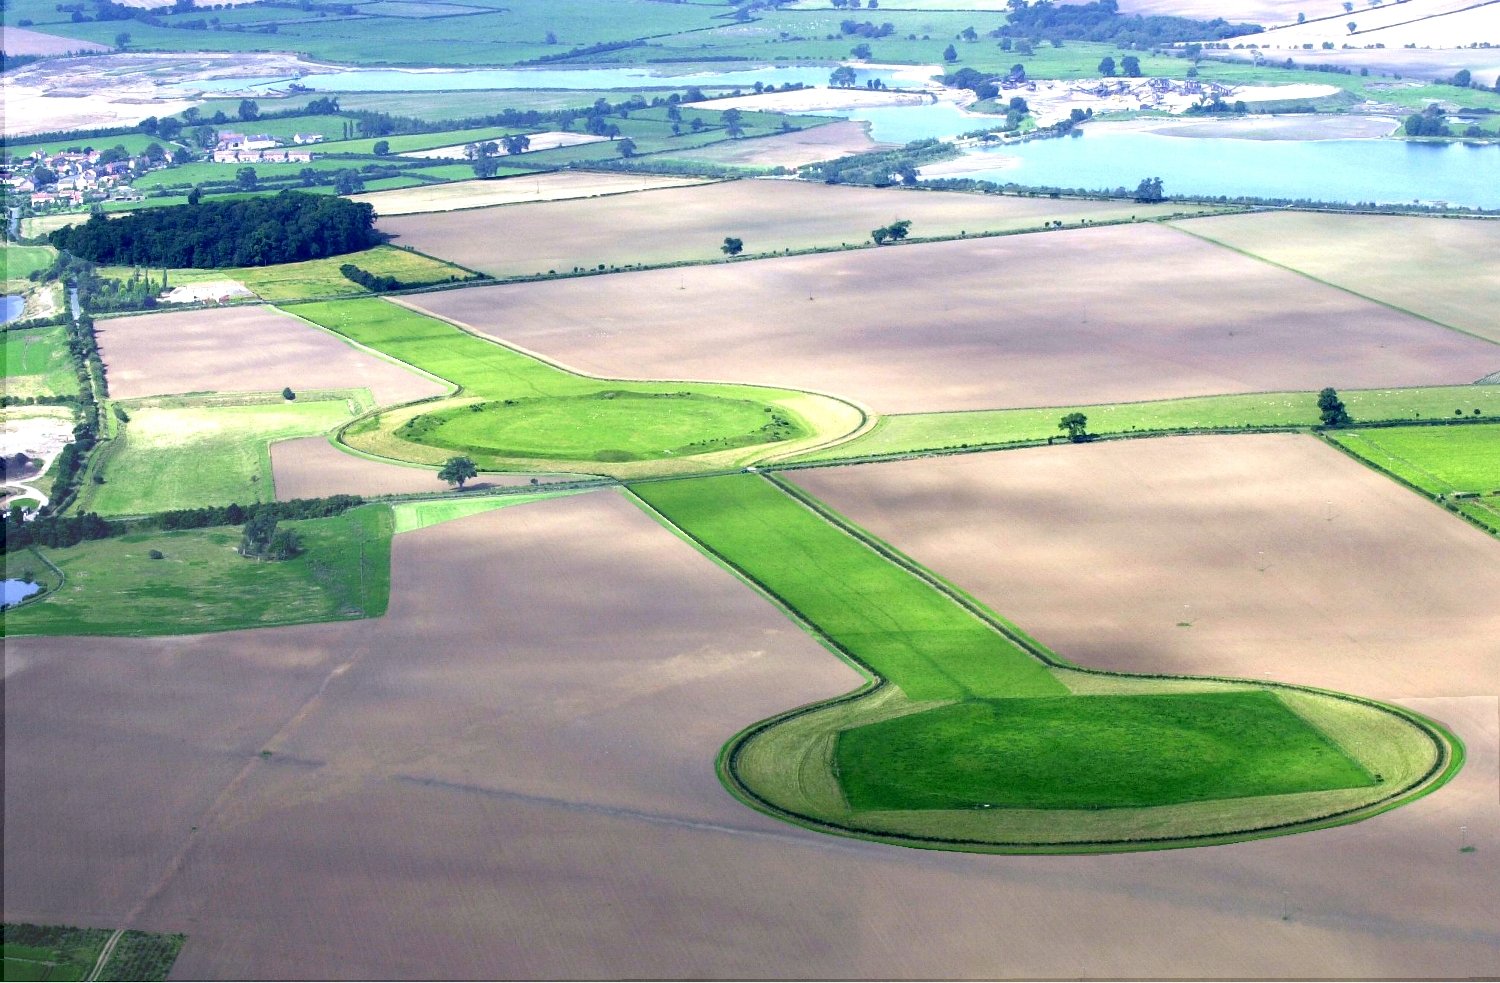
Thornborough Henges c.2004
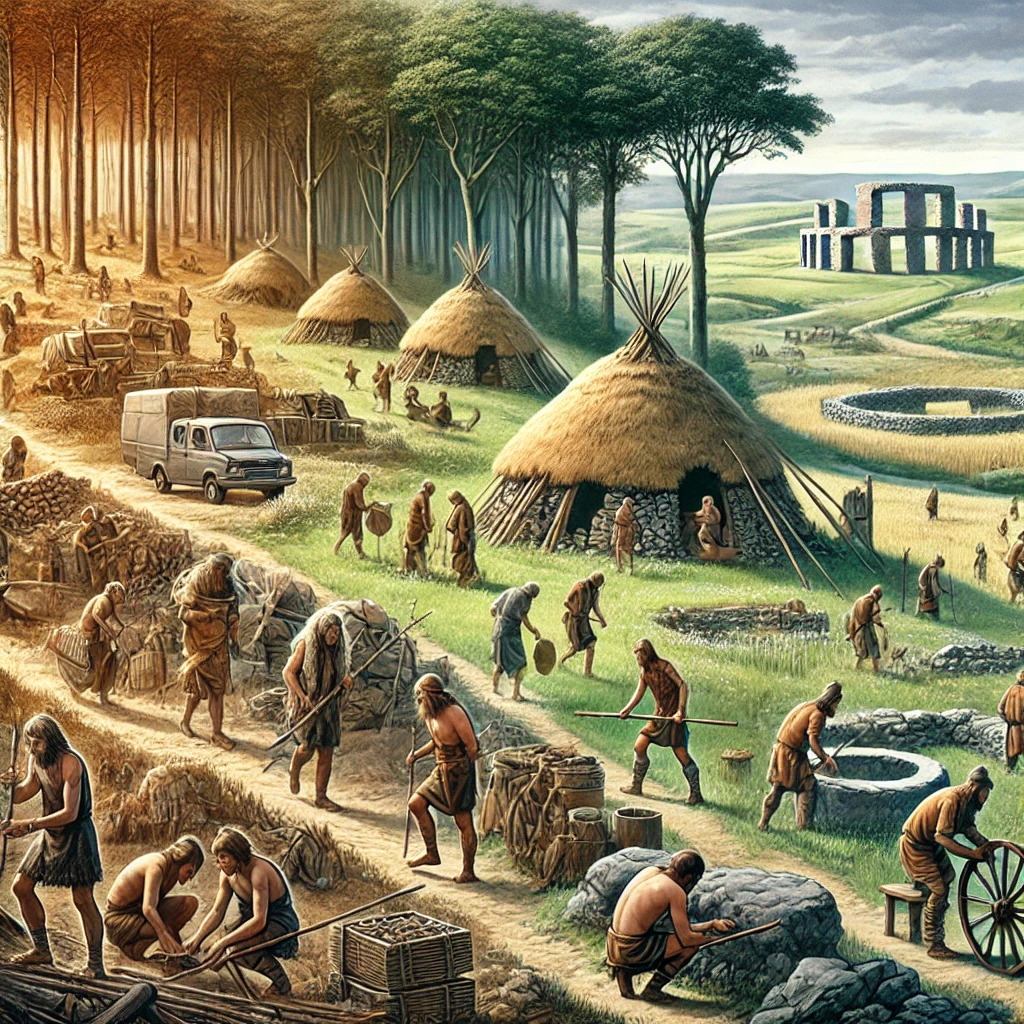
When such sites are excavated they usually turn out to be Iron Age or Romano-British in date. The farmsteads generally consist of a few small circular huts (about 8-10m in diameter), usually within a ditched enclosure. The huts themselves were made of wooden posts forming a circle, daubed with mud and with conical thatched roofs.
The interior would be smoky and dark. There were no windows and smoke from the central hearth could only escape through a small hole in the roof. In the west of the county settlements may have looked slightly different. The walls of the huts were built of stone boulders which had probably been cleared from surrounding fields. The Grubstones, a double circle of stones on Ilkley Moor, may represent the remains of one such hut circle. Boulder walling is also used in early field walls, some of which are found in the Aire valley, and may be very early in date.

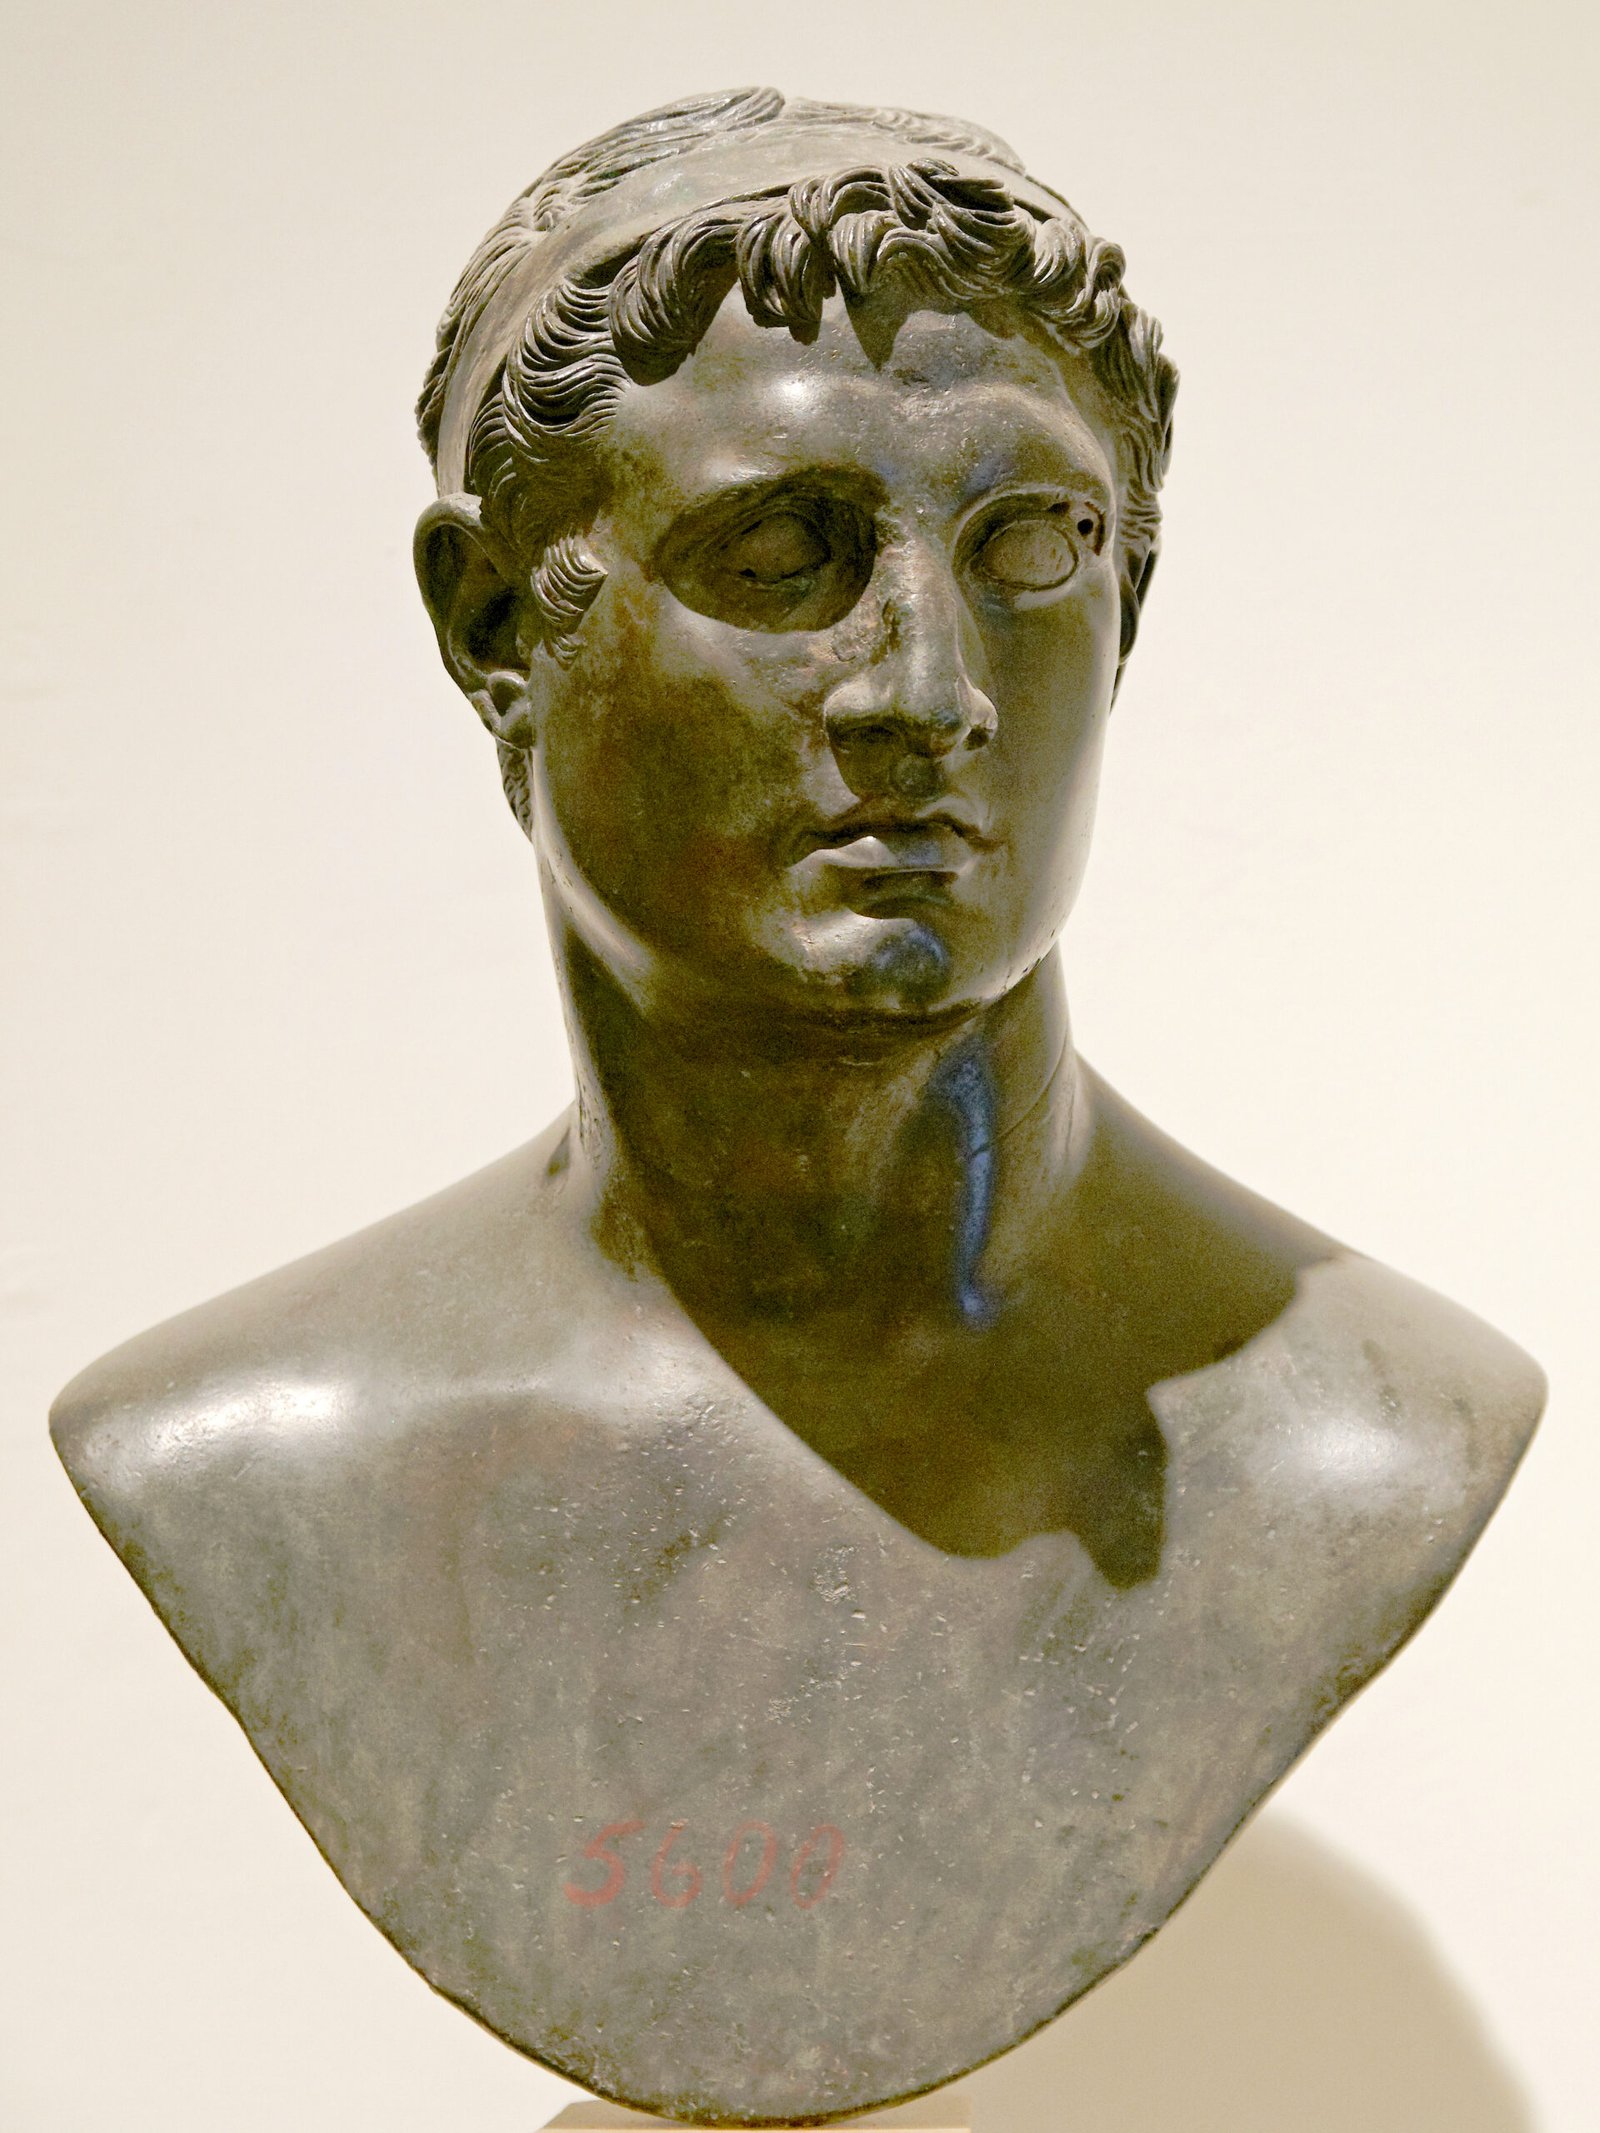
Lion head from St Andrews Church, Alborough
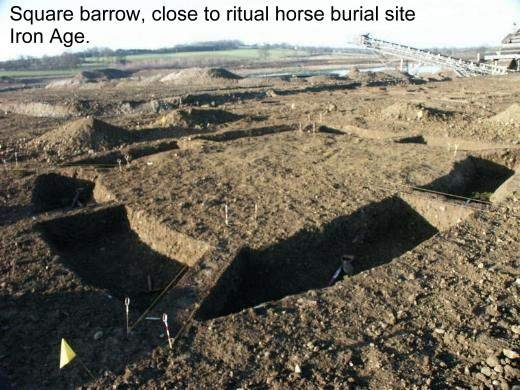
Corn storage and grinding Other than the huts themselves, few other structures can be identified in most native British farmsteads. The remains of a series of four posts arranged in the shape of squares were found at South Elmsall. Archaeologists think that the posts supported the floors of granaries or food stores. Raising the floor off the ground would help keep the food away from rats and mice. Sometimes there may be pits in which corn or other grains could have been stored, but these are rare in West Yorkshire. Burying your crop may seem an odd way to preserve food, but if the pit is lined and sealed with clay the external atmosphere cannot reach the crop and the processes of decay are halted. The principle is really the same as burying goods in air tight sealed bags today. A large number of pits are known from a site near Ledston.
Sometimes small keyhole shaped ovens are also found. Archaeologists think that these might have been used to dry out the grain before it was put into storage. When required the grain could be ground into flour by the use of a quern or hand mill. The ones which the Brigantes used are usually known as ‘beehive’ querns because of their resemblance to the old-fashioned straw beehive. They were made out of millstone Grit and tended to produce a very coarse product as the stone wore away and particles of grit ended up in the flour. For better quality breads the Romans imported lava querns from Germany. These are more hard wearing and are still sometimes used by millers today.
What do we know about the extent of Celtic influence in Yorkshire, the Romans found that a mixed farming economy was pursued throughout the territory of both the Brigantes and the Parisii. For their own ends the Romans would have sought to encourage the continuity of this practice, even if under the Roman yoke. In a few localities the outline of field systems reflecting the pattern of farming in the Iron Age can still be found at High Close and on nearby Lea Green, both near Grassington in Upper Wharfedale, also at Malhamdale overlooked by the 300 foot high Malham Cove. At each of the above locations, excellent examples of field systems date from either Celtic or the later Romano-British period.
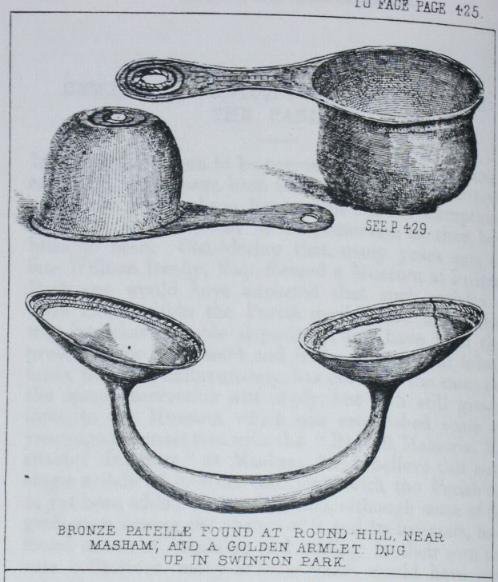
Finds from Swinton Castle
According to Stabo, the Celts occupied dwellings that were round in plan with a central hearth and which usually had storage pits dug into the floor. The walls apparently were fashioned from roughly adzed planks, set end-on and placed side-by-side, to support a thatched roof. It was a pattern very nearly continuous with those used in the earlier Bronze Age, and indeed is similar to ones still used today by ethnic groups in some Third World Countries, Papua New Guinea for example.
In the North York Moors the foundations of typically Celtic huts are to be found at several localities. Some of them are contained within an outer enclosure that served a defensive function. Examples can be seen on Borrowby Moor, at Sleddale near the banks of Codhill Slack and on Levisham Moor between Little Griff and Dundale Pond. At the Sleddale site the circular outlines of five houses, each almost thirty feet in diameter and with flagged floors, are positioned near the centre of a three-hundred-feet-long enclosure. Two additional locations in the North York Moors region are easily accessible for examination. The first of these can be clearly seen adjacent to the road along the crest of Percy Cross Rigg, one and a half miles north east of Kildale. The site enjoys a wonderful open views south and southeast over to Baysdale and Commondale, and northwest to the shapely cone of Roseberry Topping.
Curiously enough, the settlement is situated on a high point of the ridge called Brown Hill, but more about the significance of this shortly. Two miles away on Great Ayton Moor is an enclosure, square in plan, also dating from the Iron Age and which may have offered protection to dwellings, though there are no obvious signs of any. This is located only half a mile northwest of Oak Tree Farm. Another much more interesting place, this time at the opposite side of the vale of York, can be seen on Upper Wharfedale.
This site shows up prominently on aerial photographs and is also clearly visible on the ground. It is slightly south of the village of Kilnsey at Outgang Hill. An oblong enclosure some one hundred and fifty feet by a hundred, it contains the foundations of five hut circles of the style described by Strabo, each around twenty-five feet in diameter. Two smaller enclosures exist in the northern corner. Next to this a slightly larger compound, around two hundred square yards in extent, while over the nearby wall in the pasture to the northeast, a field system covers approximately 1000 square yards.
Other groups of hut circles and field systems attributed to this period can be studied in the parallel valleys of Wensleydale and Swaledale. Here the Iron Age is well represented on Addleborough Hill, again near Stony Raise, and above West Burton to the south of Dove Scar. Two additional sites that invite a visit are found at Arngill Scar, where hut foundations occupy a ledge overlooking the River Swale, flowing here through the impressive Kisdon Gorge.

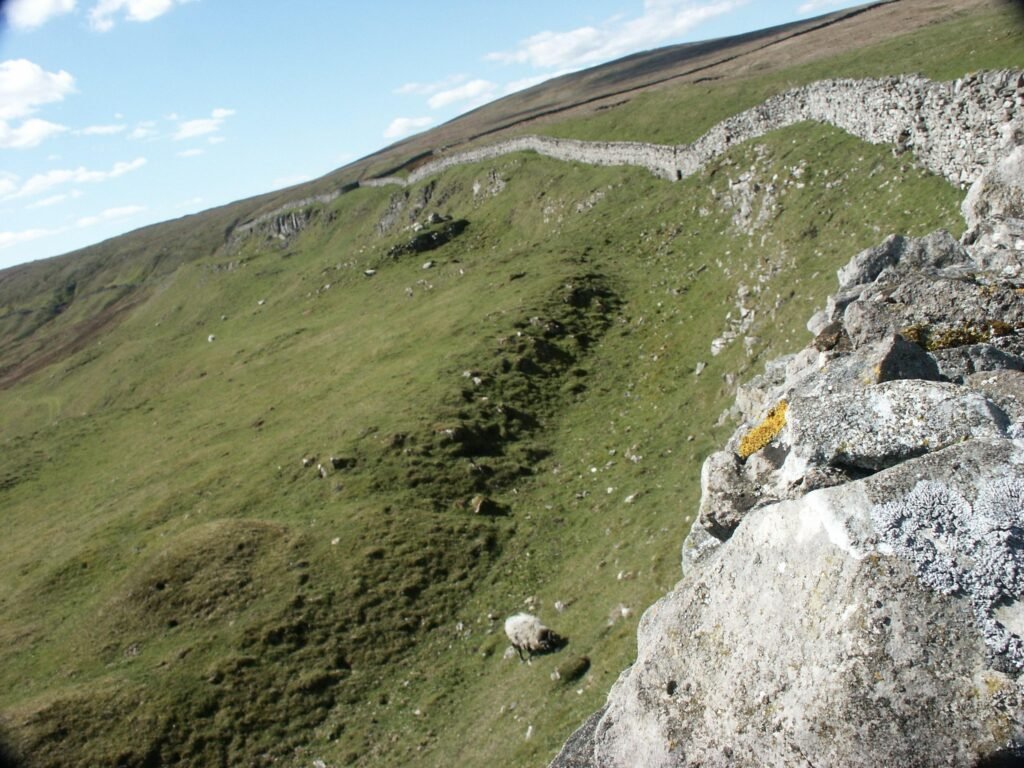
Hut circle at Harkerside
Seven miles down the Dale, there is another site on Harkerside Moor close to the Maiden Castle. Here we find a few hut circles contained within an outer perimeter banking.
The site is generally believed to date from the late Bronze Age, though it is possible that the site saw co-habitation between Bronze Age native and Celt, or was an adaptation contemporary with the early Iron Age.
Other Earthworks dating from the later period exist in the vicinity, and this together with the fact that the name ‘maiden’ incorporates the Celtic place-name element ‘dun’ meaning a fortified place, seems to lend further weight to the assumption that the Celts made use of an existing facility. This is just one instance in which place-names can provide clues to the past. The system of farming pursued by both Brigantes and Parisii was mixed arable with livestock rearing.
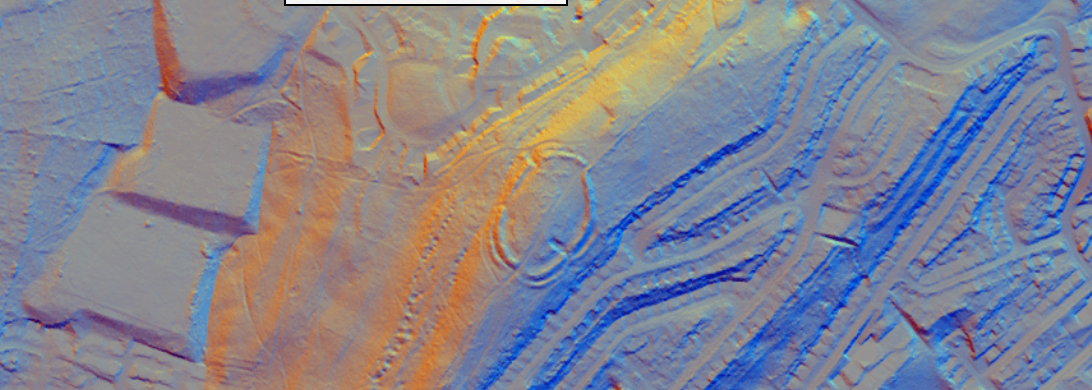
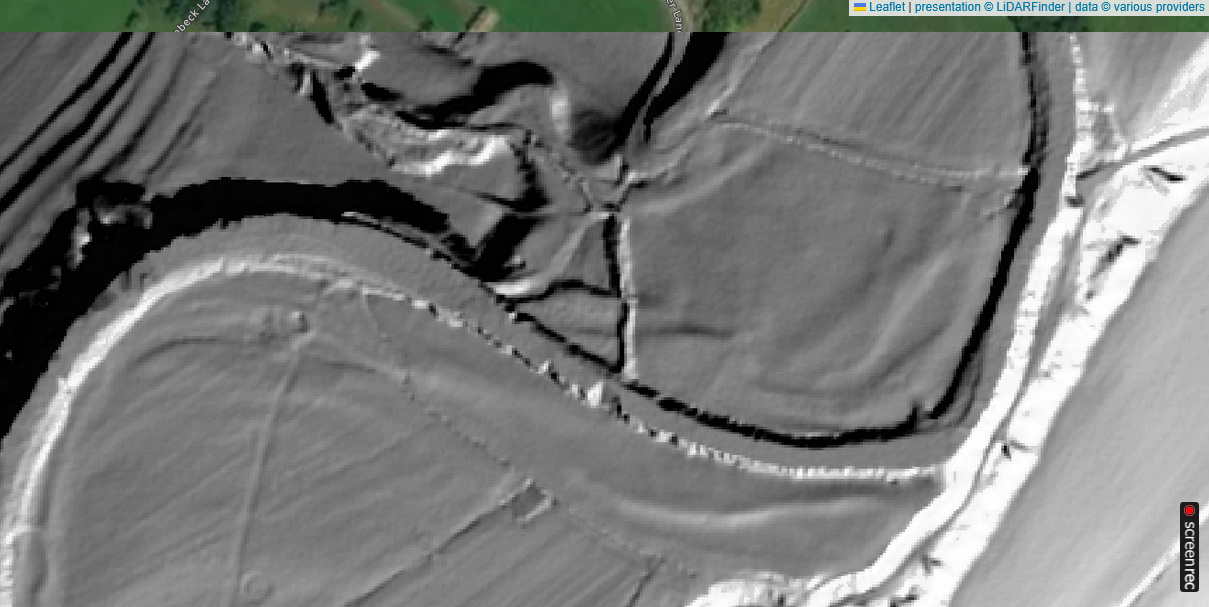
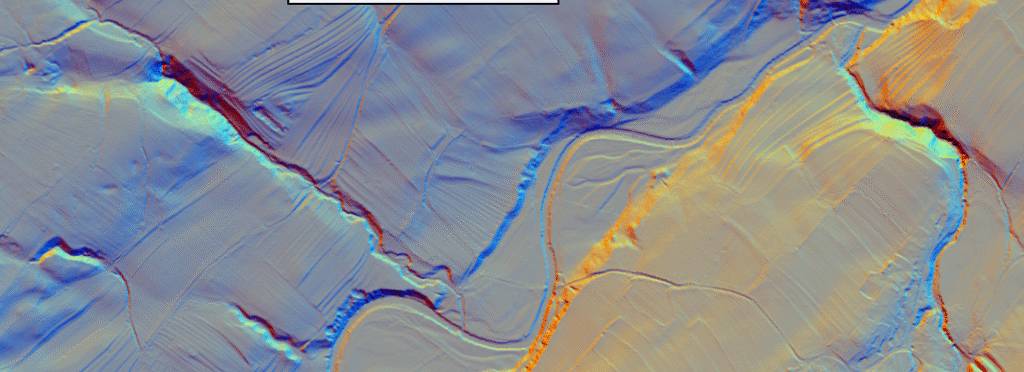
Barley, oats, flax and rye were all cultivated, while the domesticated animals were represented by sheep, cattle, goats, pigs and horses. Grazing was confined to swampy areas of the lowlands and loftier regions of the North York Moors and Pennine regions, the better land being preserved exclusively for cereal crops. Wharfedale has produced several querns, proof that an arable economy existed concurrent with a pastoral lifestyle. In the south of the country, evidence for Iron Age farming activities has until fairly recently been rather sketchy but, with the introduction of air photography and LiDAR as archaeological tools, many new sites of farmsteads, enclosures and settlements have been discovered.
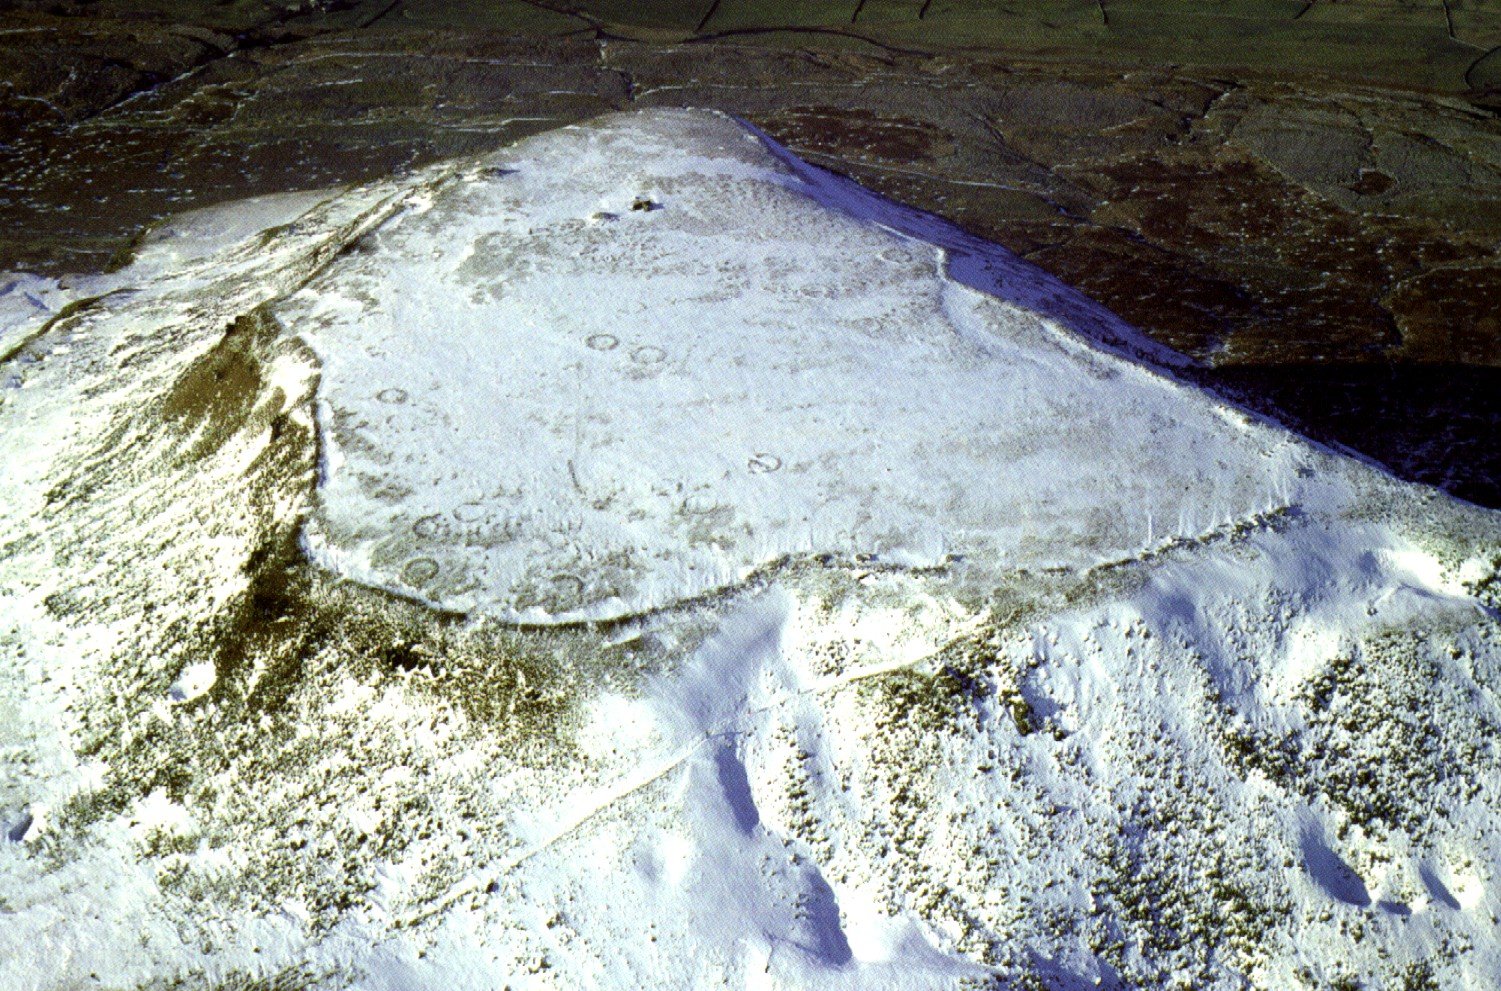
This method of investigation is beyond the scope of the amateur but the study of conventional aerial photography is accessible to the reader fortunate enough to have access to a collection of local authority aerial photographs or even a light aircraft. When viewed from a sufficient altitude and under optimum conditions the outlines of sites can be clearly revealed. A low sun angle helps to highlight the relief of the landscape, including prehistoric remains; at other times, a light dusting of powdery snow can show up the countryside below, just as French chalk makes a fingerprint visible.
Not all sites discovered by these methods have been positively dated to the Iron Age, neither are the techniques restricted to the detection of sites from that period; it works just as well for settlements as old as the Neolithic. Either way though, these locations rarely present any visible features for the ground-based investigator. This technique has also revealed sites of suspected Iron Age around Malton, in the southern area of the North York Moors, though again these are not visible on the ground.
In our quest for the roots of the county’s past, there is an amazing oblivion to the fact that evidence is all around us, often on our very ‘doorstep’. Within our hybrid language, for instance, there are components reflecting earlier cultures. That any Celtic place-names have emerged from the Teutonic invasions of the Dark Ages and even the blitz kreig colonialism of the Normans is a measure of the lasting influence Celtic culture had on settlers like the Anglo-Saxons and Danes. Several place-name components were handed down, though not always without change. An examination of these enduring signposts to the past can enliven a day out for ramblers in the Celtic territories of Brigantia.
Throughout the region we are concerned with there are place-names identified with Celtic sources. Included among these are Rotherham, Fangfoss, Glaisdale, names beginning with Eccles and Otley’s popular playground, The Chelvin. This is almost certainly a time-warped version of another word meaning ‘ridge’ and is similar in pronunciation to the Welsh Celtic ‘Cefn’.
The once fashionable spa town of Ilkley is the Olicana that was eventually to hold such a strategic importance for the Romans, while the name Craven, for the upland region forming the southern part of the Yorkshire Dales, could be derived from the Celtic Craf, referring to the wild garlic which still flourishes in woodland gills of the area. Further to the east, the North York Moors National Park has its Cod Hill and Cod Beck, both seemingly embodying the element coed, meaning wood in the Celtic tongue.
Cattle farmers
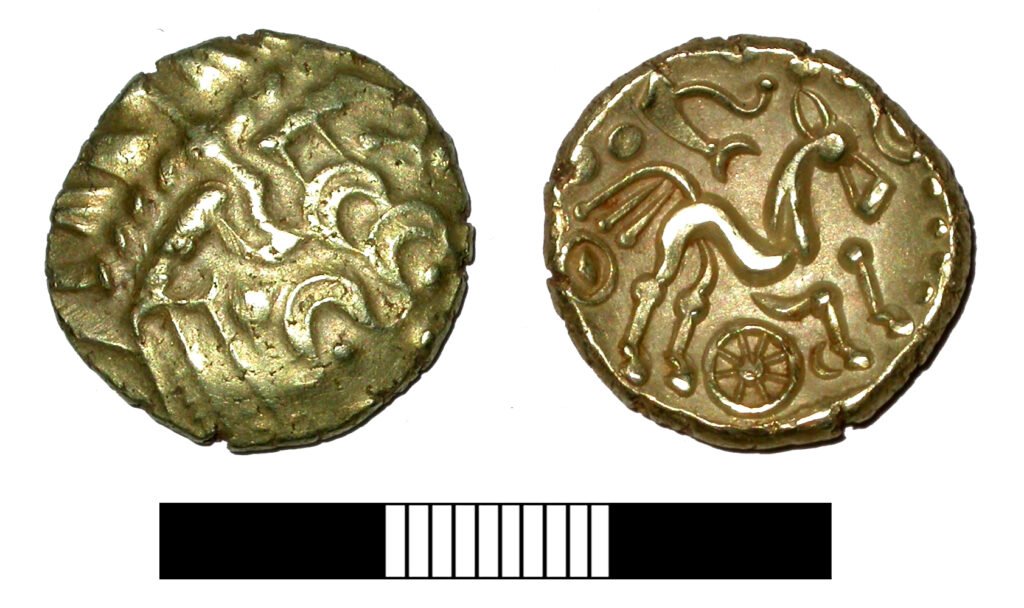
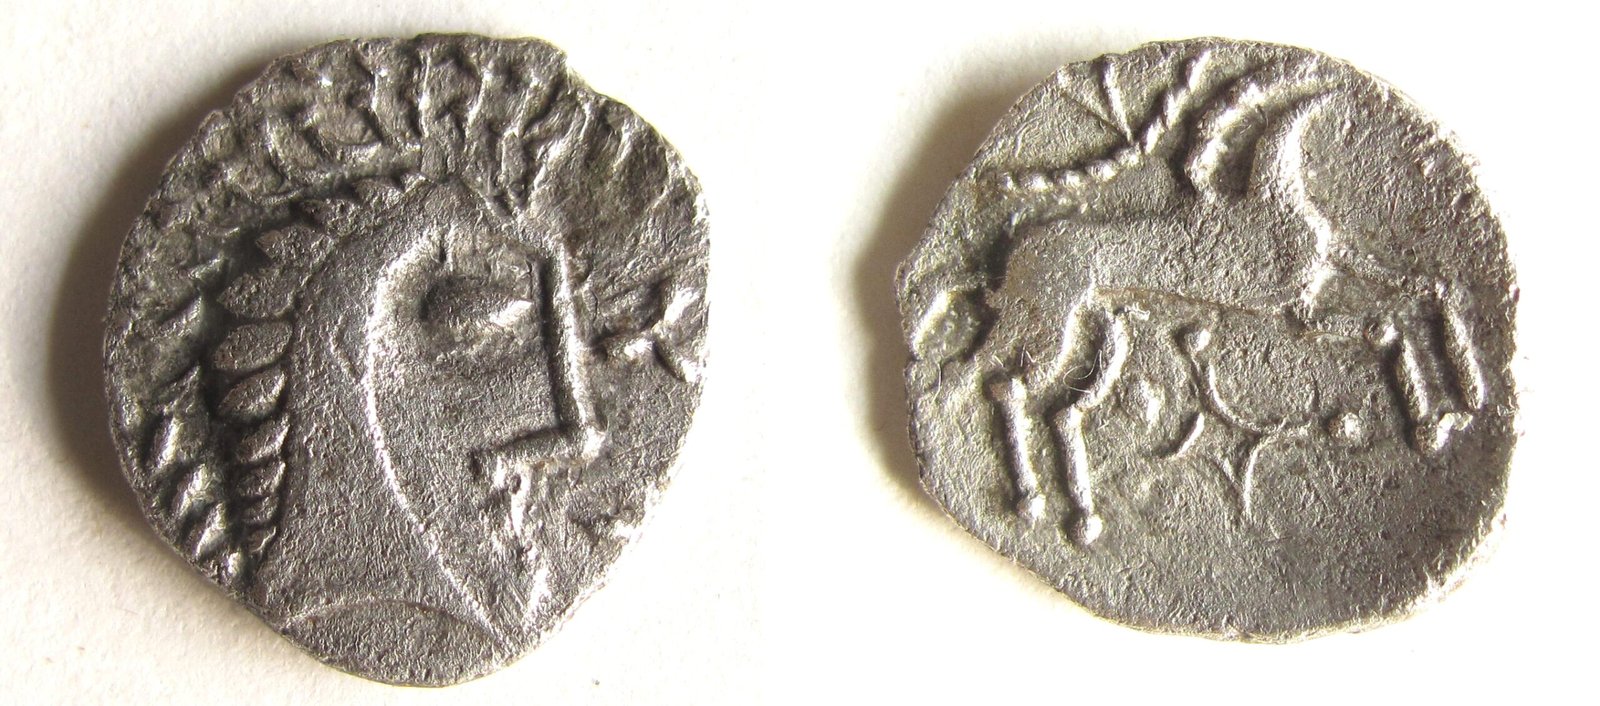
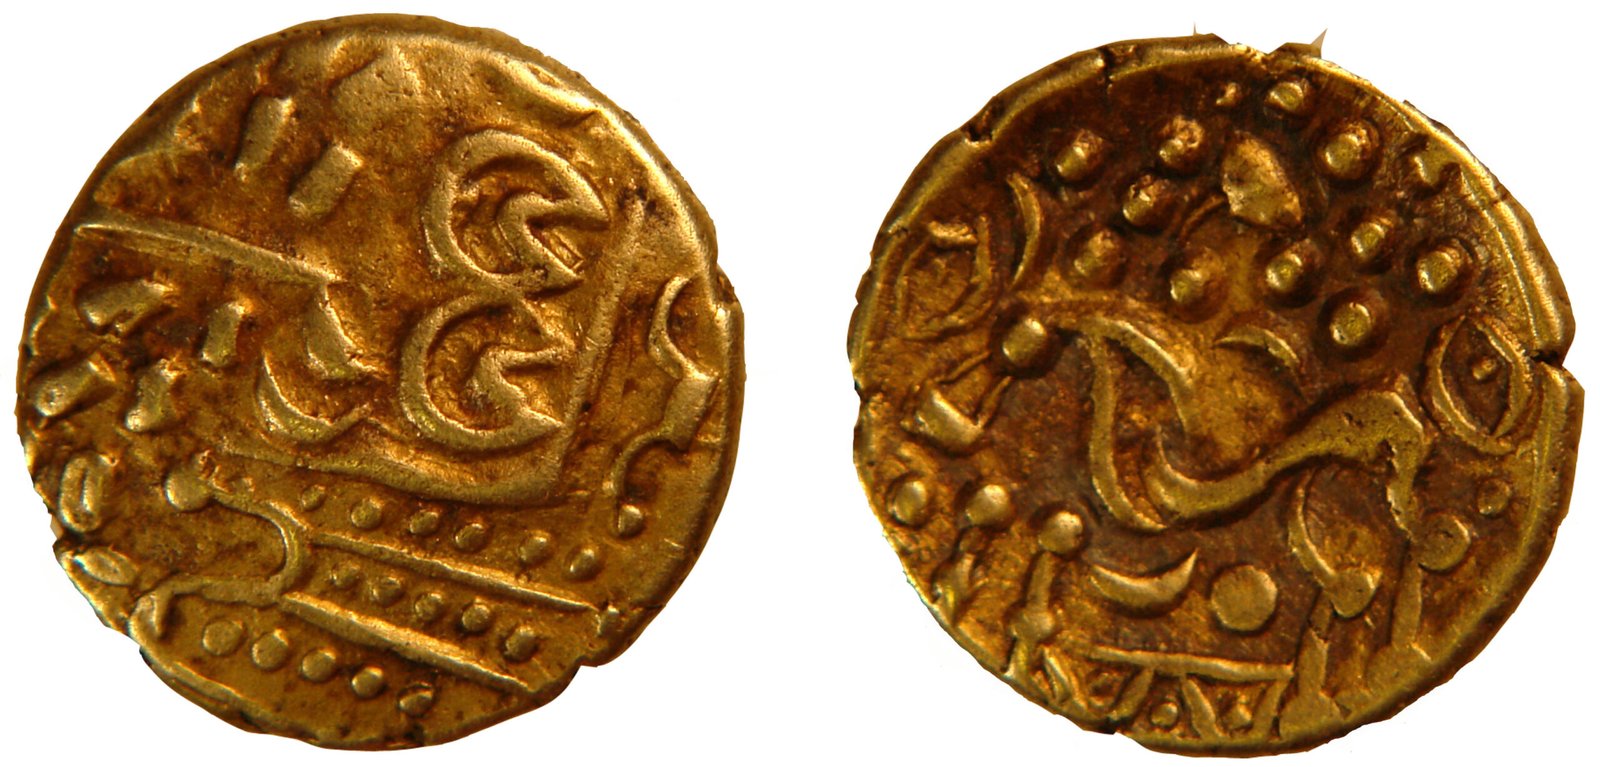
Although coins were introduced into the south of Britain before the arrival of the Romans, the habit of using money had not reached West Yorkshire before the arrival of the Romans. The Brigantes probably measured their wealth in cattle and some of the enclosures which archaeologists have identified on aerial photographs are probably stock pens to keep their animals in.
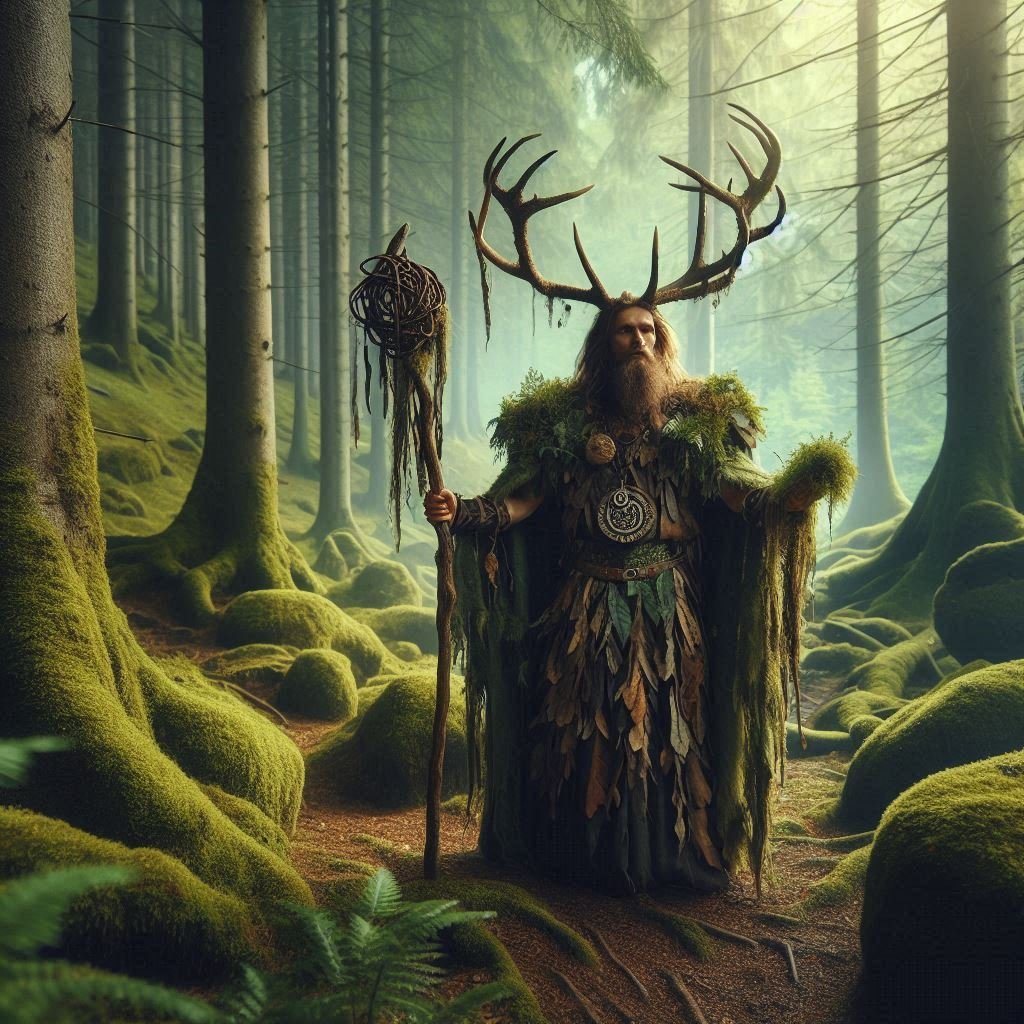
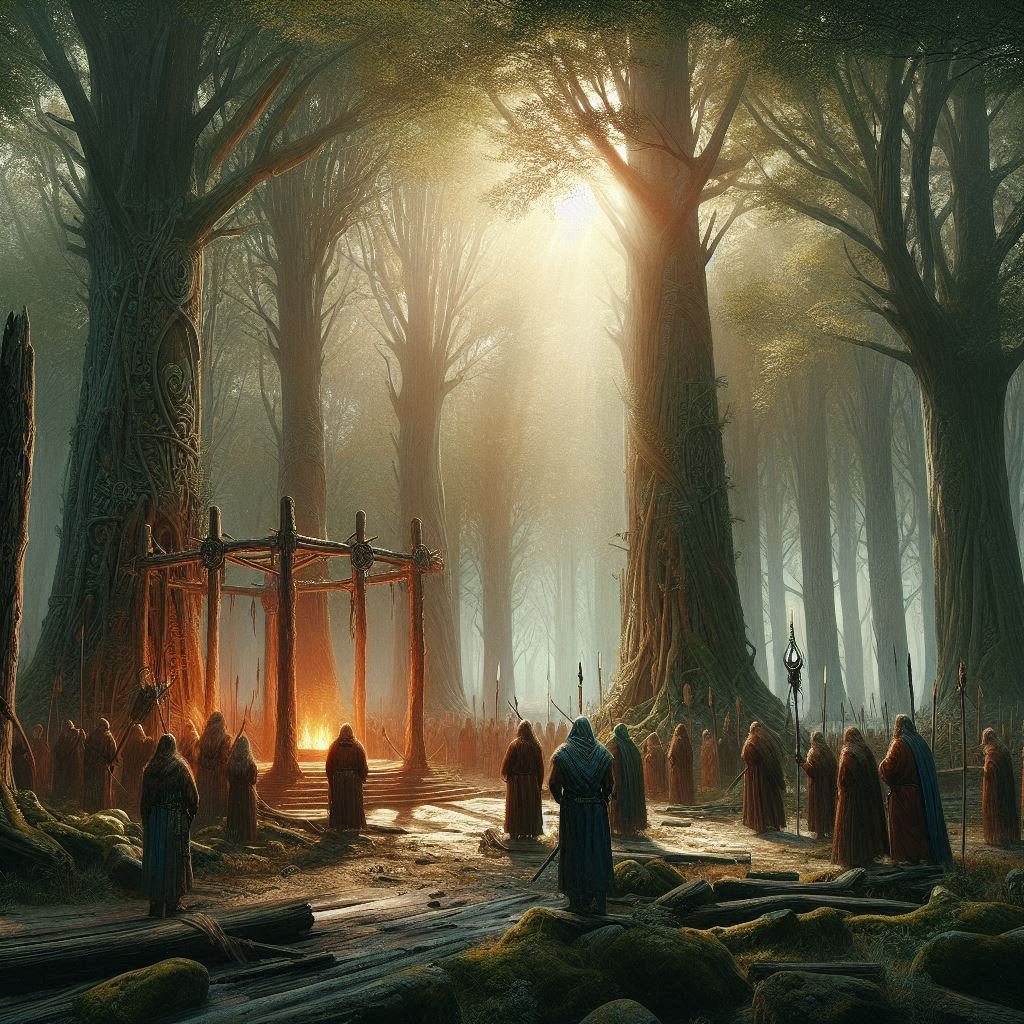
The Druids
Julius Caesar’s accounts of the Celts describe one influential caste, the Druids as men of elevated learning, absorbed with the contemplation of sacred groves, the moon, the sun and other heavenly bodies, but also bent upon appeasing their gods in the most barbaric of manners. The Druid’s pagan religion evolved a doctrine of immortality, a glorious life after death, which no doubt goes some way towards explaining the daring courage of their warriors on the battlefield.
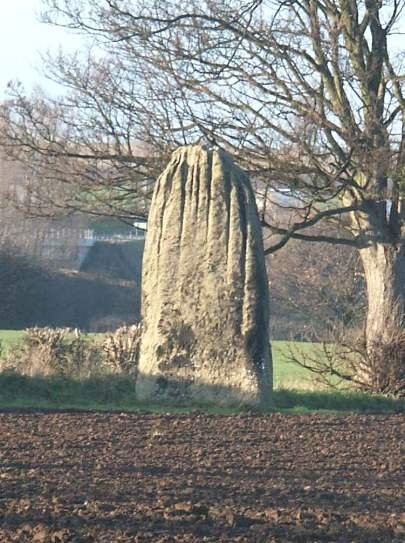
The third and shortest stone in the Devil’s Arrows Stone Row at Borroughbridge
Much of our knowledge of the Celts is owed to the Romans, but it is from them also that later cultures inherited a common misconception about this mysterious race. The Romans believed, quite incorrectly, that the so-called Druids were responsible for the erection of megalith monuments like the stone avenues at Carnac in Brittany, Stonehenge and probably our own Devil’s Arrows, no doubt built to serve their pagan excesses in times of social stress. Standing stones like those famous arrows were already ancient when the Celts arrived and contrary to what the Romans believed could not, as we now know have been erected during the Iron Age.
This distorted picture of those learned High Priests of Celtic society was embroidered upon by the writings of the Victorian romantic Cartographers jumped on the ‘band wagon’ so we find natural features throughout the Country that have been linked with what were imagined to be the pagan beliefs and practices of Iron Age Britain.
In Yorkshire there is a Druid’s Altar on a prominent Gritstone outcrop overlooking Bingley in the Aire Valley, while near the Hamlet of Bordley, in the Yorkshire Dales National Park, a group of three standing stones is variously marked on Ordnance Survey Maps as Druid’s Circle and Druid’s Altar. This was thought originally to be the remains of an embanked circle, or due to its ruinous state, a small chambered grave.
It has since been considered to be the surviving pillars of a megalith four poster, a burial site of a type normally found in Scotland. Others have conceived tenuous links between the Celts and the more prominent and strangely weathered natural rocks. The celebrated gritstone outcrops at Brimham Rocks are no exception. Just what the connection, if any, might have been between these sites and the colourful image of the Druid’s is anyone’s guess.

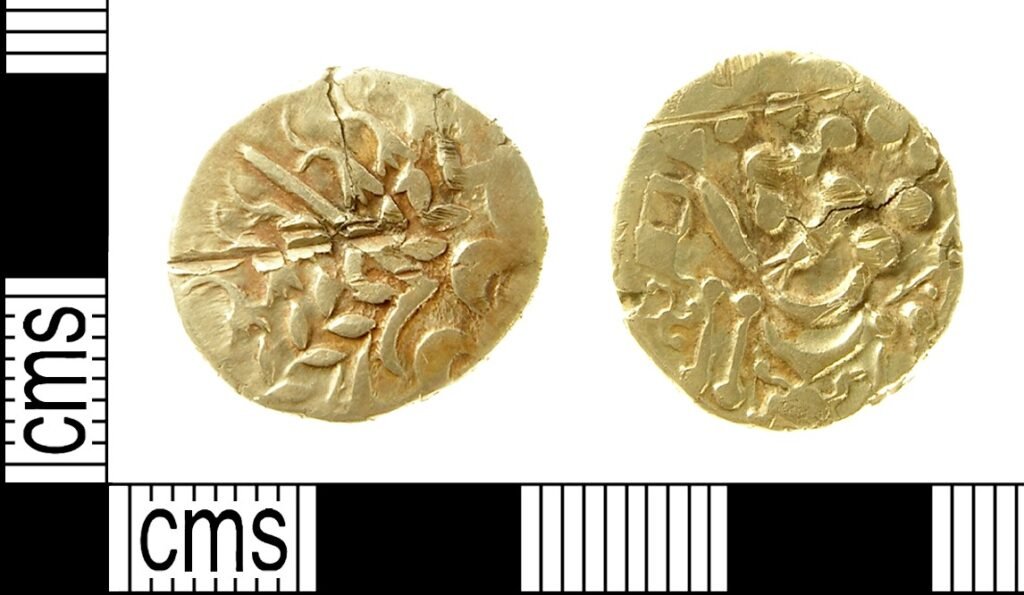
Spears from the Whittingham Hoard
I would recommend a visit to the Bingley outcrop, or better still the weirdly-eroded rocks at Brimham, but wait for one of those stormy days for which the Pennines are well known. When the elements are locked in battle and leaden clouds hang overhead like harbingers of certain doom, it takes a little stretch of a fertile imagination to visualise these blackened, time ravaged stones in use as sacrificial altars.
Being realistic though, it is unlikely that these exposed stations were the scenes of bloodletting or other pagan customs. The stories are no doubt good for tourism promotion. Gruesome sacrifices were prevalent in Iron Age Britain, however.
We do know that some ritual interpretation manifested itself in human votive offerings. These acts were more grievous than simple bloodletting to appease the mortal gods. According to Caesar we are given to understand that the Celtic functionaries ordered huge hollow figures to be built in human likeness, fashioned from the branches of trees. Into these young men were herded and the effigy set alight in a ghastly carnage by fire.
The auspices of the Celtic pantheon did not come cheap, for those unfortunates making the donations at least. Curiously enough, in the tiny village of Wensleydale village of West Witton a quaint tradition bears an uncanny resemblance to the Celtic custom, though of course it does not include human immolation.
Burning Bartle
The Burning Bartle ceremony takes place annually on the Saturday nearest Saint Bartholomew’s Day. A larger than life human effigy, fashioned of Wickerwork and stuffed with straw, is paraded around the village streets until after dark, when it is burned on a bonfire to the accompaniment of a chanted rhyme:
At Penthill Crags he tore his rags
At Hunter’s Thorn he blew his horn
At Capplebank Stee he brak his knee
At Grassgill Beck he brak his neck
At Waddem’s end he couldn’t fend
At Grassgill End he made his end
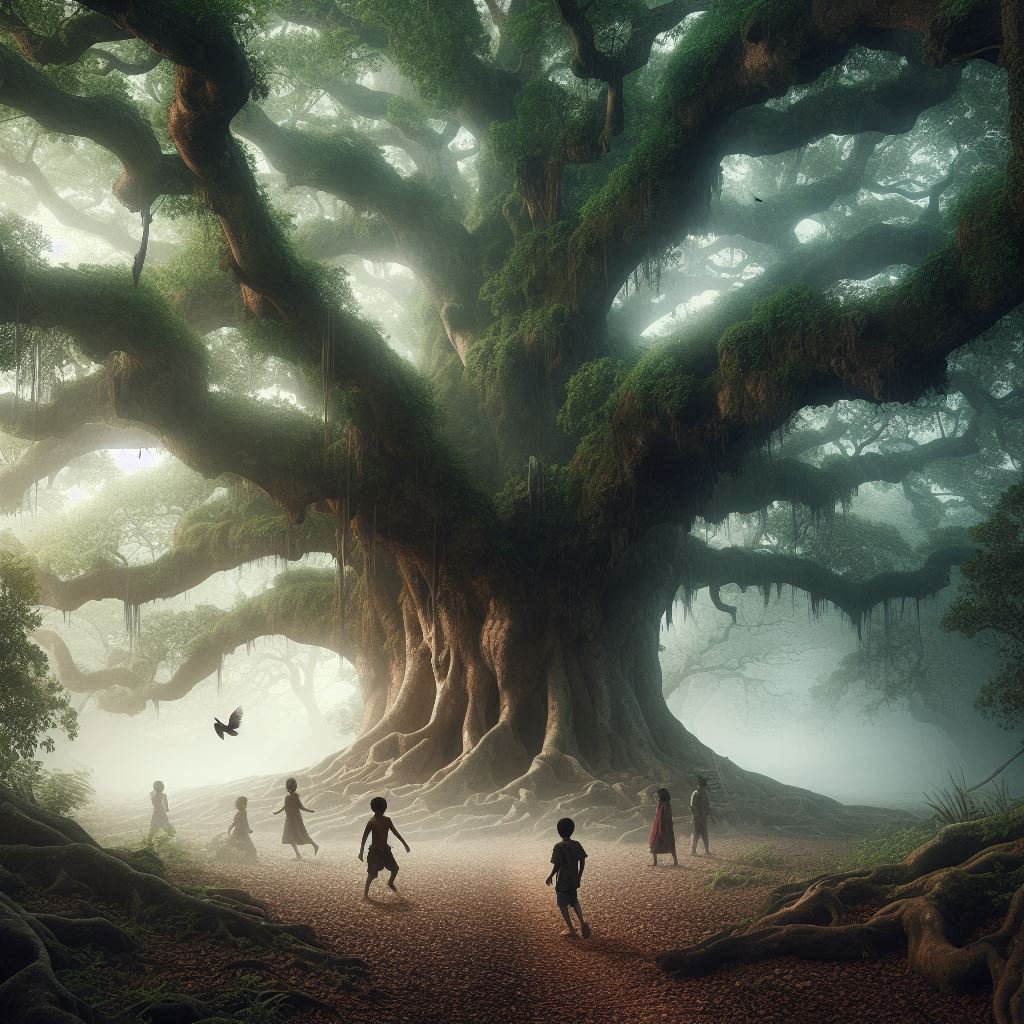
Exactly who or what was Bartle is, today, a mystery. He may have been the sheep-stealing giant who, according to local tradition, is said to have roamed on nearby Pen Hill. Perhaps Bartle was a spirit of the extensive forests that once thrived in the dale, or is he simply the faded memory of an ancient fertility symbol?

Perforated deer skull with antlers from Star Carr
Others have suggested that it represents the Saint, and though the timing of the custom appears to support this theory, one cannot entirely dismiss the vague similarity between this and the barbaric Celtic practice. Penhill is a further link in the cultural ‘chain’, incorporating the Celtic place-name component, pen, linking present times with the Iron Age.
The three basic elements of the earth and firmament, those of air, fire and water, have been the objects of veneration in all places from the earliest of ages. In these were have the evidence in support of the earliest forms of ritual ceremony. The classical writers at the time of the Roman conquest recorded that groves, rivers, and especially wells and springs, were sacrosanct to the Celtic spiritual well being. Ordeal by fire has already been highlighted as one method by which they solicited the will and co-operation of their gods. Others existed. In Yorkshire we have the clearest evidence that a water cult persisted throughout Brigitania.
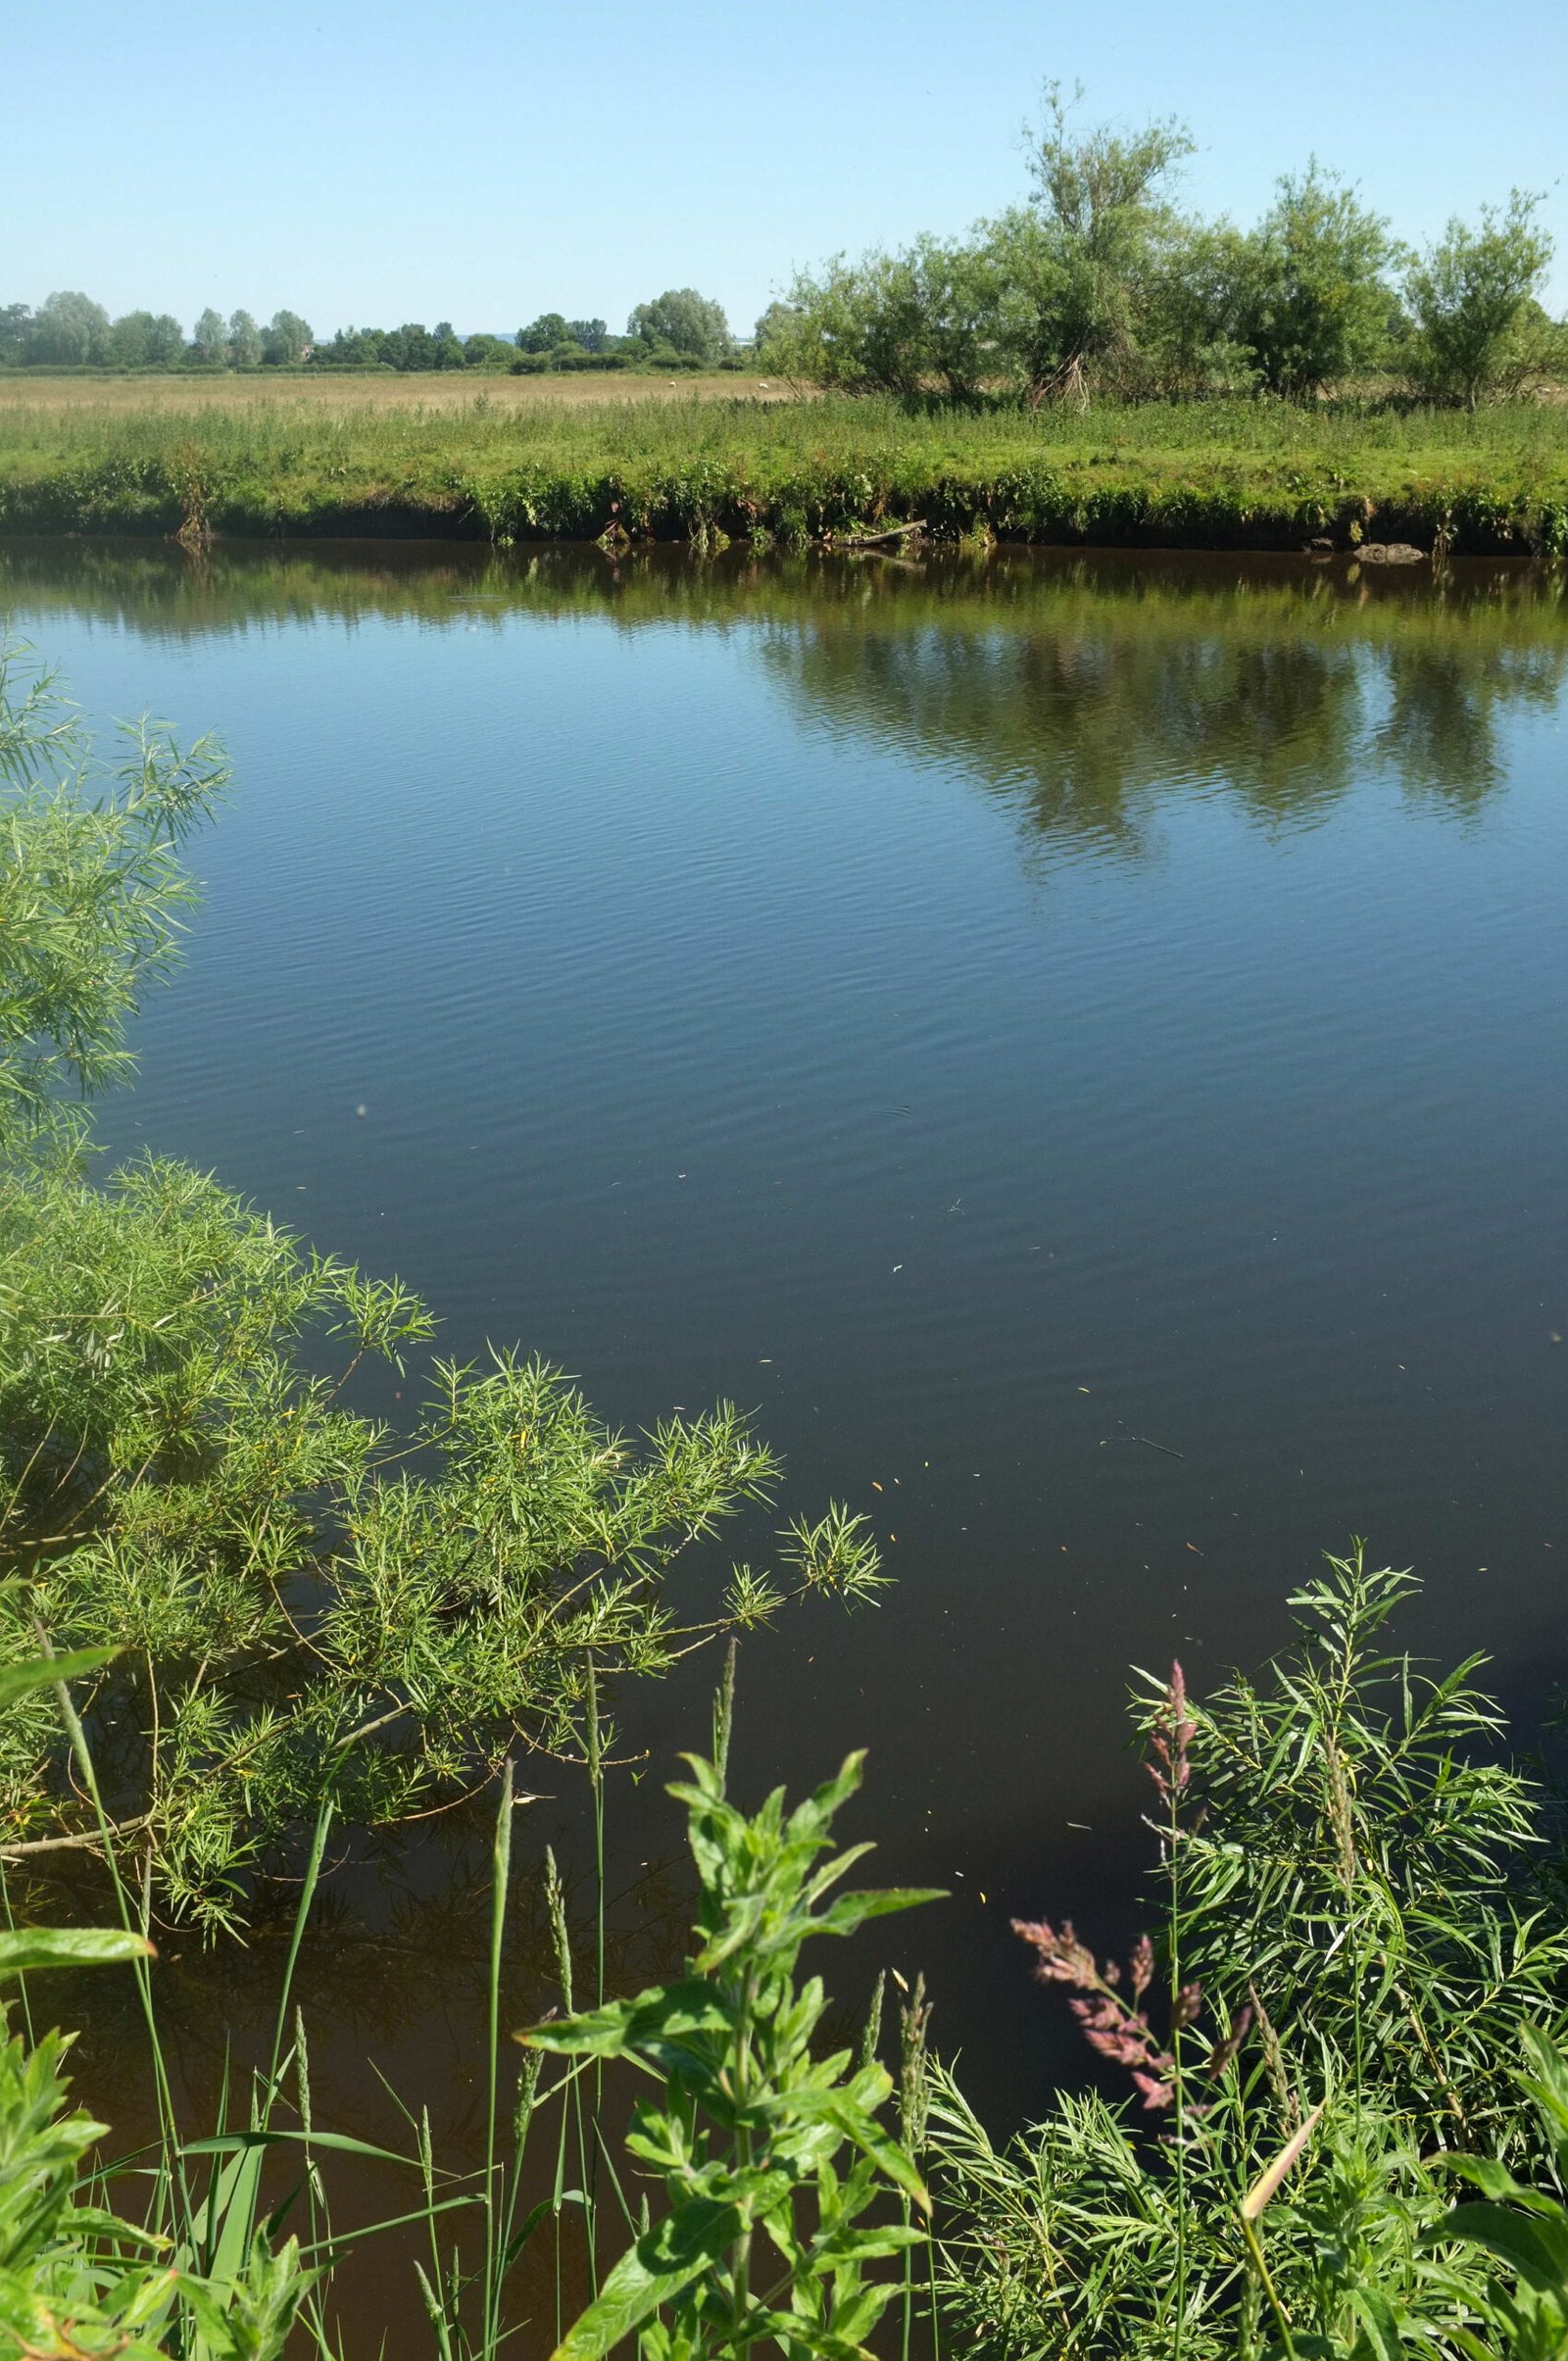
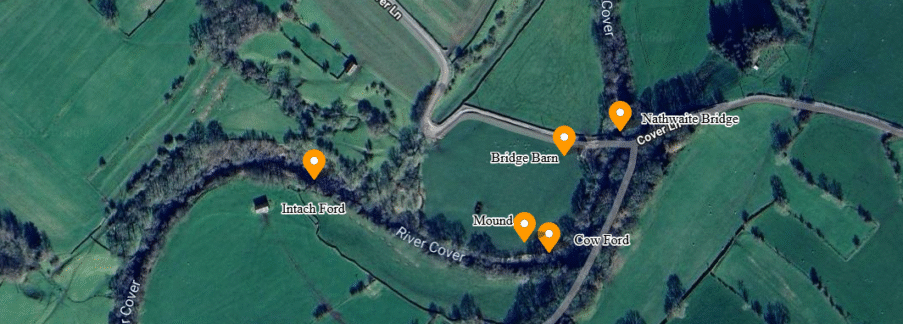
Rivers

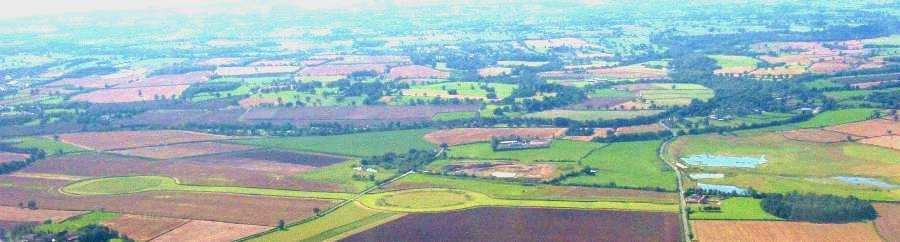
Cleave Dyke – Post war air photography project
Many rivers in Yorkshire have retained their original Celtic names – Ouse, Derwent, Esk and Aire, for example. Some were dedicated to the patron water nymphs, for instance Verbeia is believed to be the ancient name for the Wharfe, named after its goddess. Others reflect the clarity, good mood or other aspect of the watercourse, as in the Nidd. Interestingly, the fort established by the Romans by the River Dana was given the Latin form of Danum, thus carrying forward the British River name component to be preserved in the modern Doncaster.
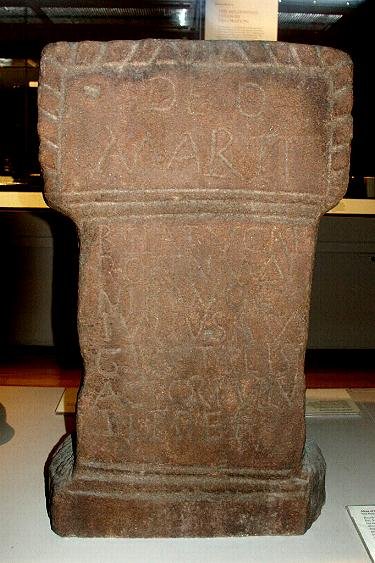
Altars consecrated to pagan divinities have been discovered in various localities. The Ilkley altar bears an inscription, which reads “Sacred to Verbeia: Clodius Fronto, perfect of the Second Cohort of Lingonions”. A second dedicated altar was found at a river shrine near Bowes. Not only were the rivers the sacred abodes of beneficial spirits, but even springs and wells held a special place in the magico-religious order of the Druids.
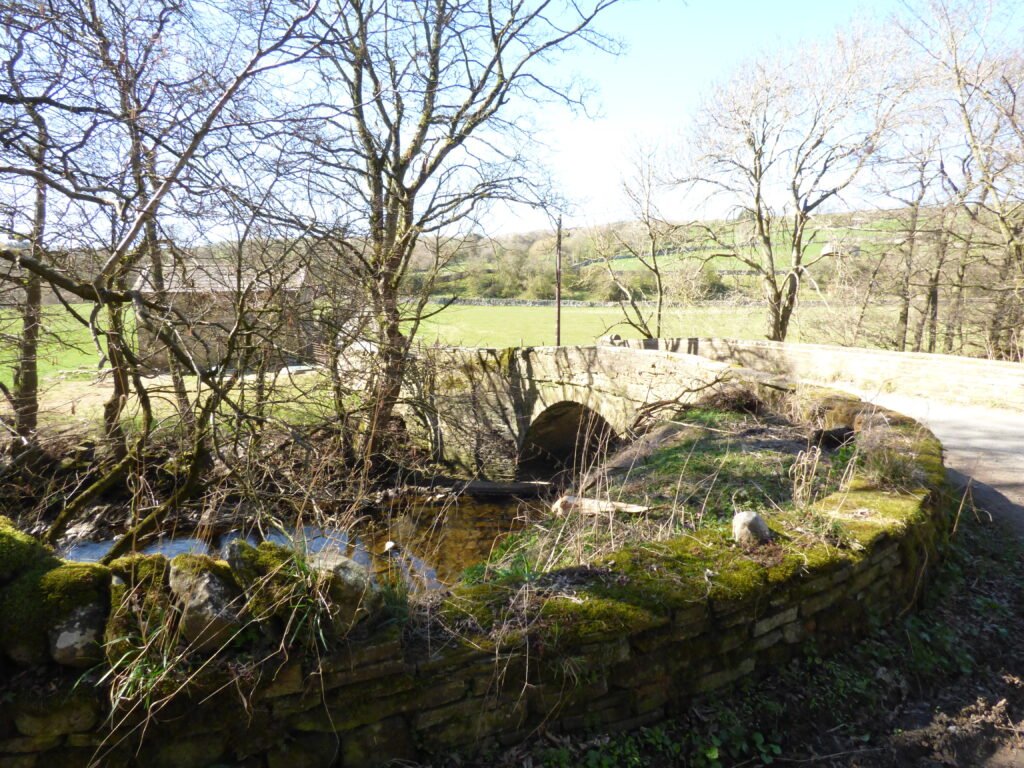
In Brigitania votive objects in various forms were cast into watery places. In the sleepy hamlet of Settle, there is evidence to support the theory that here an important centre of Brigitanian worship once existed.
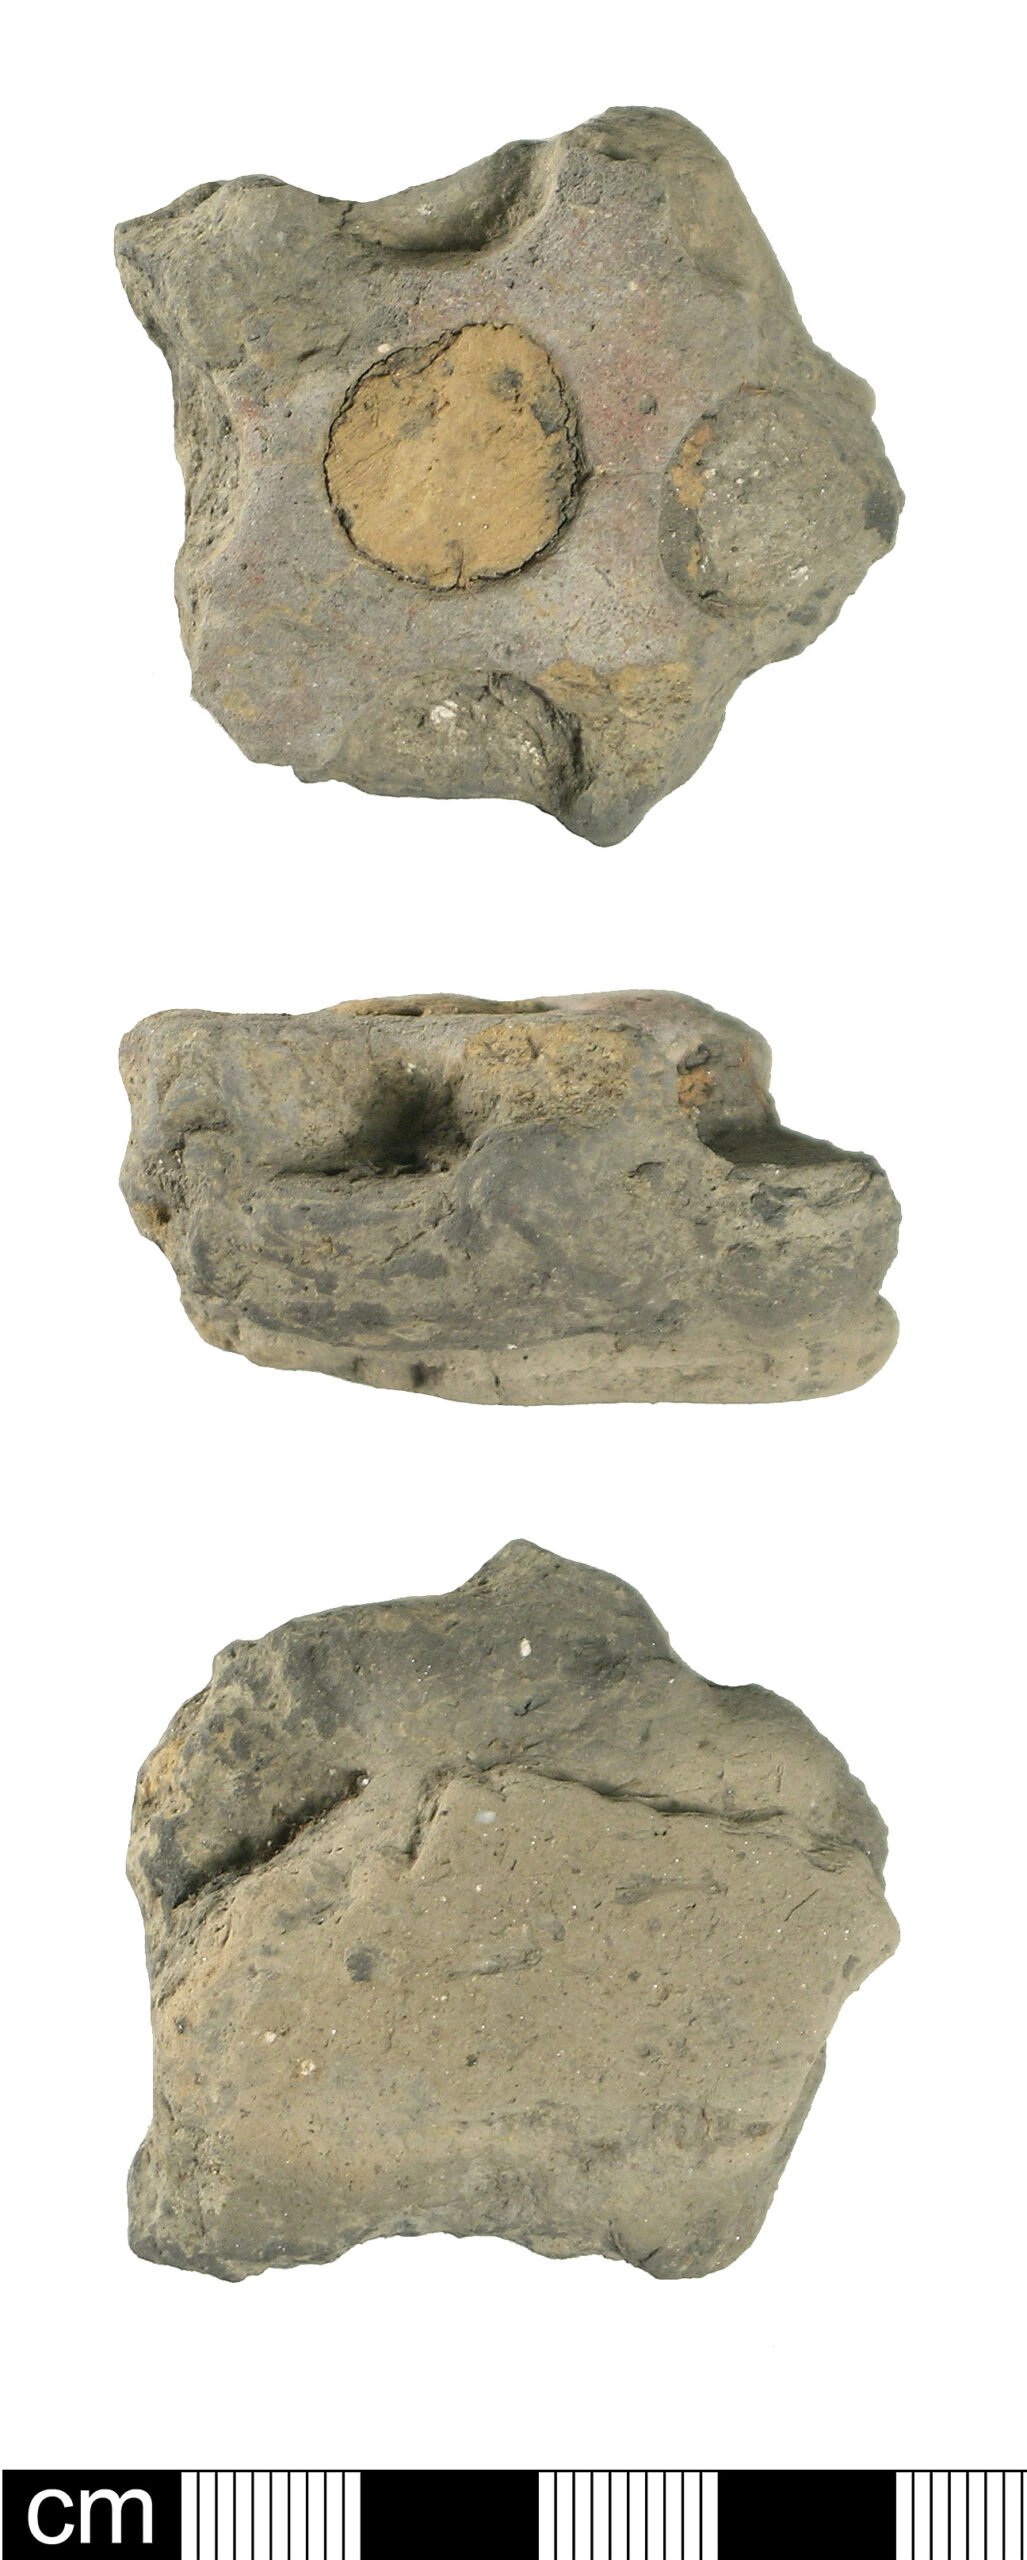
The hamlet is situated at the centre of three ancient wells. Just a short stroll from the church of Saint Alkelda is the well at Bankwell, covered with a stone slab and pouring its water into a stone trough. Towards the end of the last century, a small lead figurine was found in the well. It is about 7.5 cm high and was once housed in the defunct Pigyard Museum, in Settle. It is now in private ownership. Due to its appearance the figurine was believed to be a toy dating from Tudor times. It was recognised, however, that some of the crudely executed features parallel a similar style of decoration found on a bronze shield contemporary with the La Tene culture found in a hoard at Merioneth.
The similarities are so identical as to rule out coincidence. Moreover, it is even postulated that the Bankwell figurine may represent the Celtic goddess Brigantia herself – suggested that Giggleswick church stands on or close to the site of an important pagan shrine, possibly dedicated to this deity.
The church at Giggleswick is generally associated with the nearby Ebbing and Flowing Well, whose strange fluctuations have baffled travellers for centuries. It is not unreasonable to believe that this site, too, would have enjoyed some importance in those days and received its share of votive offerings. It still does if the number of coins and other objects found in it are any indication.
 At some time in the past all the wells in Giggleswick have enjoyed fame for their healing waters, including the Holy Well on the site of Giggleswick School next to the church. Built into the fabric of St Alkeldas in Giggleswick can be seen two carved stone heads, obviously much more ancient than the building itself, and which may originally have come from a heathen shrine at either of its three wells.
One head forms a Corbel to an internal arch, while a second specimen has been incorporated into the outer surface of the north wall of the nave, where it gazes coldly in the direction of the Ebbing Well a mile away to the north-west. These carved heads have been identified with a Celtic Pagan Cult, which persisted in the Iron Age Brigantia, but we shall discuss this further in the next chapter. Another matter, linked in some way with the Bankwell figurine, concerns the so-called naked man café, formerly an inn of the same name.
Besides making votive offerings to lakes, pools and other aqueous features of landscape, objects were also deposited in caves or cast down any convenient natural shaft. In Wookey Hole, Somerset, a famous instance was the discovery of several human skulls. Given the fact that Craven was at the heart of Brigantia one wonders what role if any, the deep abyss of Gaping Gill played in Celtic Paganism?
It is easy to allow the imagination Drift back two millennia, to a scene of human sacrifice, victims cast into the depths of this frightful pot-hole as libation to the deities of the nether regions. Within the cultural context of caves the significance of Attermire Cave leaves us in no doubt. Iron types of wheels, lynch pins and nails discovered at this site could simply have been the remains of a native wain, though its location in a cliff face remote from the nearest possible track makes this very unlikely. Somebody went to a lot of drag the vehicle up a steep scree slope, not easy to negotiate even without a burden, and to deposit it carefully within the cave. This is a sure indication of some ritual activity, despite the lack of sepulchral deposits.
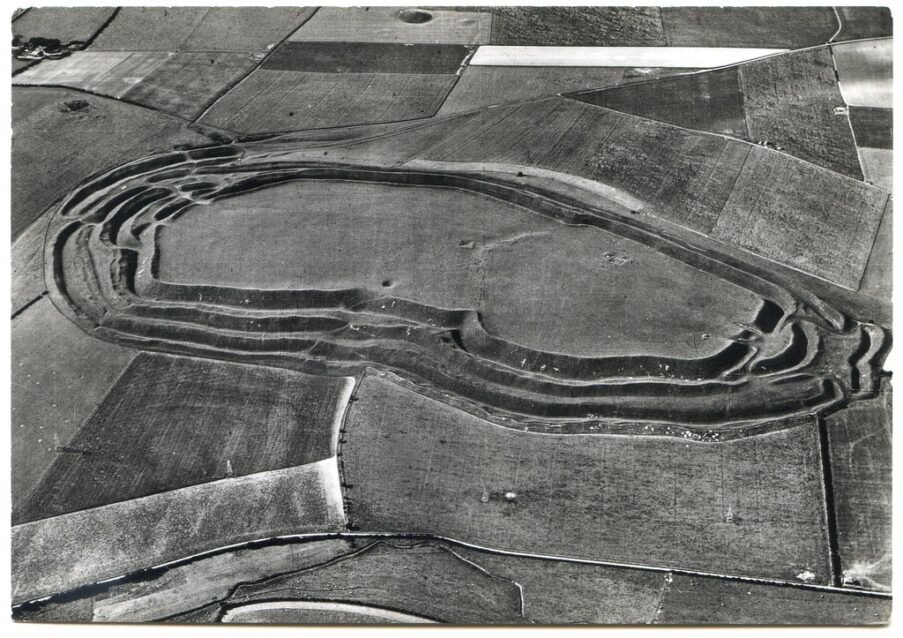
The Fall of Brigantia
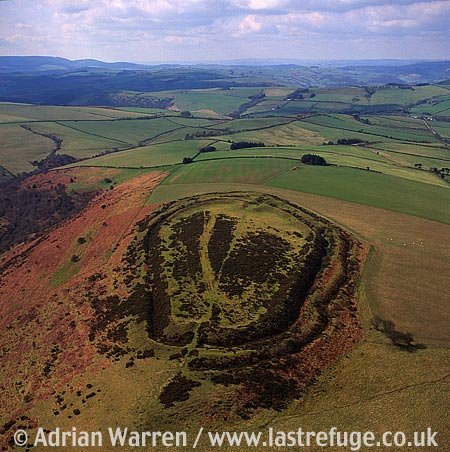
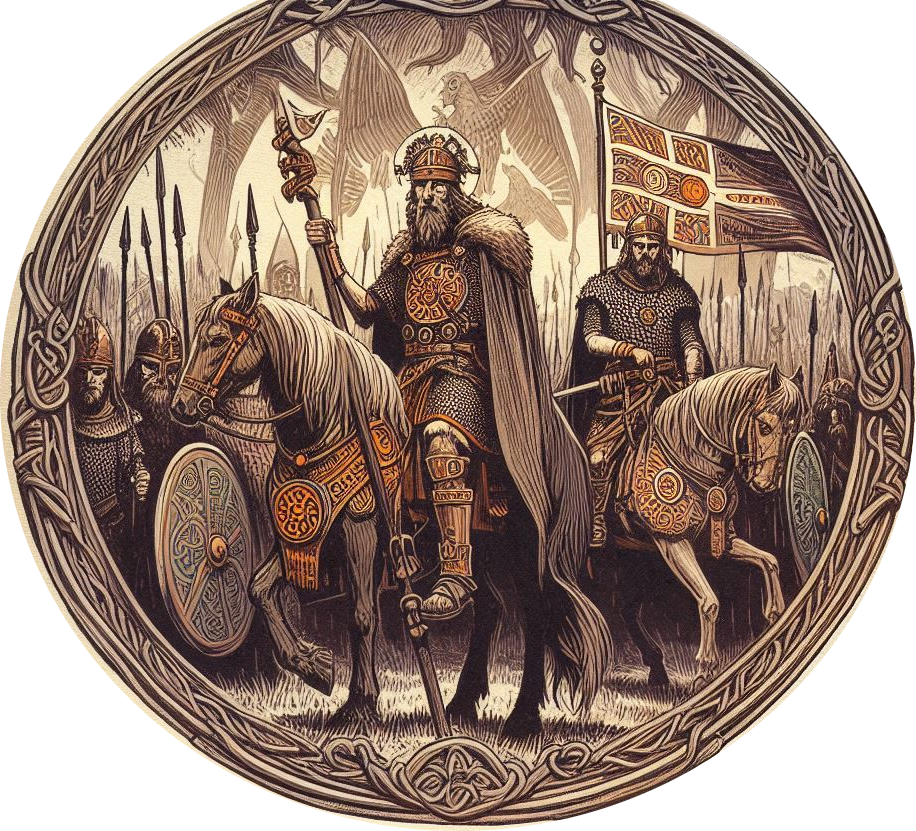
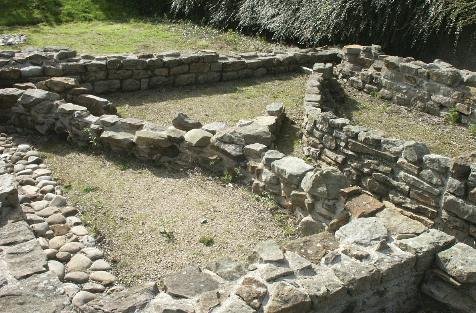
When the Romans arrived in the first century, they found the vast Brigantian tribal federation in the neck of Britain organized under Queen Cartimandua (c. 43 to c. 70 AD), whose seat was at the massive fortification of Stanwick. Cartimandua’s husband was acknowledged as king, assuming the role as the Brigantian warlord.
The Roman historian Tacitus (Annals 12.40, 2-7; Histories 3.45; Koch 1995:39-40) specifically acknowledges that it was Cartimandua, the living symbol of Brigantia, who held the ultimate power among the Brigantes and had an active role in choosing her husband/warlord.
Indeed, it has been suggested that the Welsh word for king, brenin, is derived from brigantinos meaning the consort of Brigantia (Koch 1995:39). The Romans must have been pleased when they found that Cartimandua favored establishing formal contacts and alliances with them. Although firm evidence is lacking, it is believed that Brigantia became a Roman client kingdom as early as the 40’s AD (Hanson and Campbell 1986:73).
Initially, Brigantia prospered as a client state and grew wealthy. In 51 AD, Caratacus son of Cunobelinus, the leader of Celtic resistance to the Romans in the south, was captured and brought before Cartimandua, who promptly turned him over to the Romans.8 Tacitus (3.45; Koch 1995:40) credited Cartimandua’s capture of Caratacus as “having secured the most important component of Emperor Claudius’s triumph”.
In the following years, relations broke down between the Brigantian Royal household. Cartimandua divorced her husband Venutius and took as her husband another warrior named Vellocatus (“better in battle”), Venutius’s former armour bearer. However this was no simple divorce for, by this action, her new husband became king. Tacitus (3.45; Koch 1995:39-40) recorded that the divorce and remarriage prompted a civil war among the Brigantes because the majority of the people preferred Venutius as king. Yet, Cartimandua’s will prevailed, “favouring the illegitimate husband [Vellocatus] were the queen’s libido and her ferocious temper” (Tacitus 3.45; Koch 1995:40).
Venutius, who had previously fought for the Romans, turned to the anti-Roman faction among the Brigantes for support and ignited a civil war. The war continued for some time among the Brigantes until Venutius was on the eve of victory. With Cartimandua in a compromised position, the Romans intervened to save their ally (Salway 1993:92). Roman intervention saved Cartimandua but in the end her actions gave the Romans an excuse to conquer Brigantia.
The Romans could not tolerate the long Brigantian border in the hands of a hostile king who could not only attack the south himself but also harbour Roman enemies from the south (Salway 1993:92). To the Brigantian’s, the fault for their conquest by the Romans would have fallen squarely on the shoulders of Cartimandua and the war between her husbands . . . and would not have been forgotten.
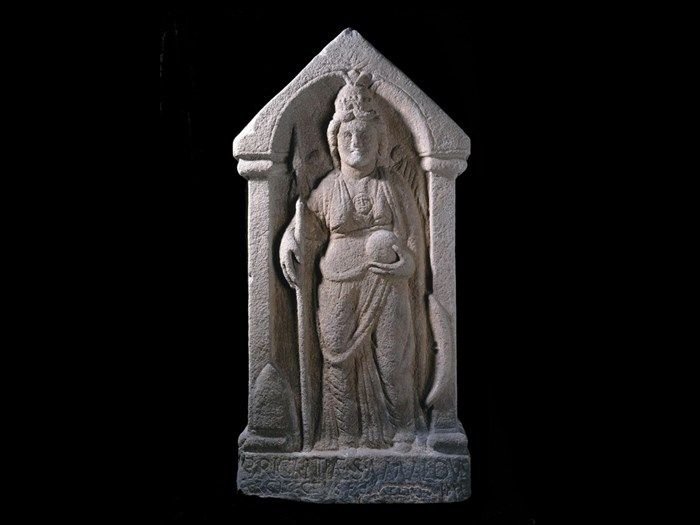
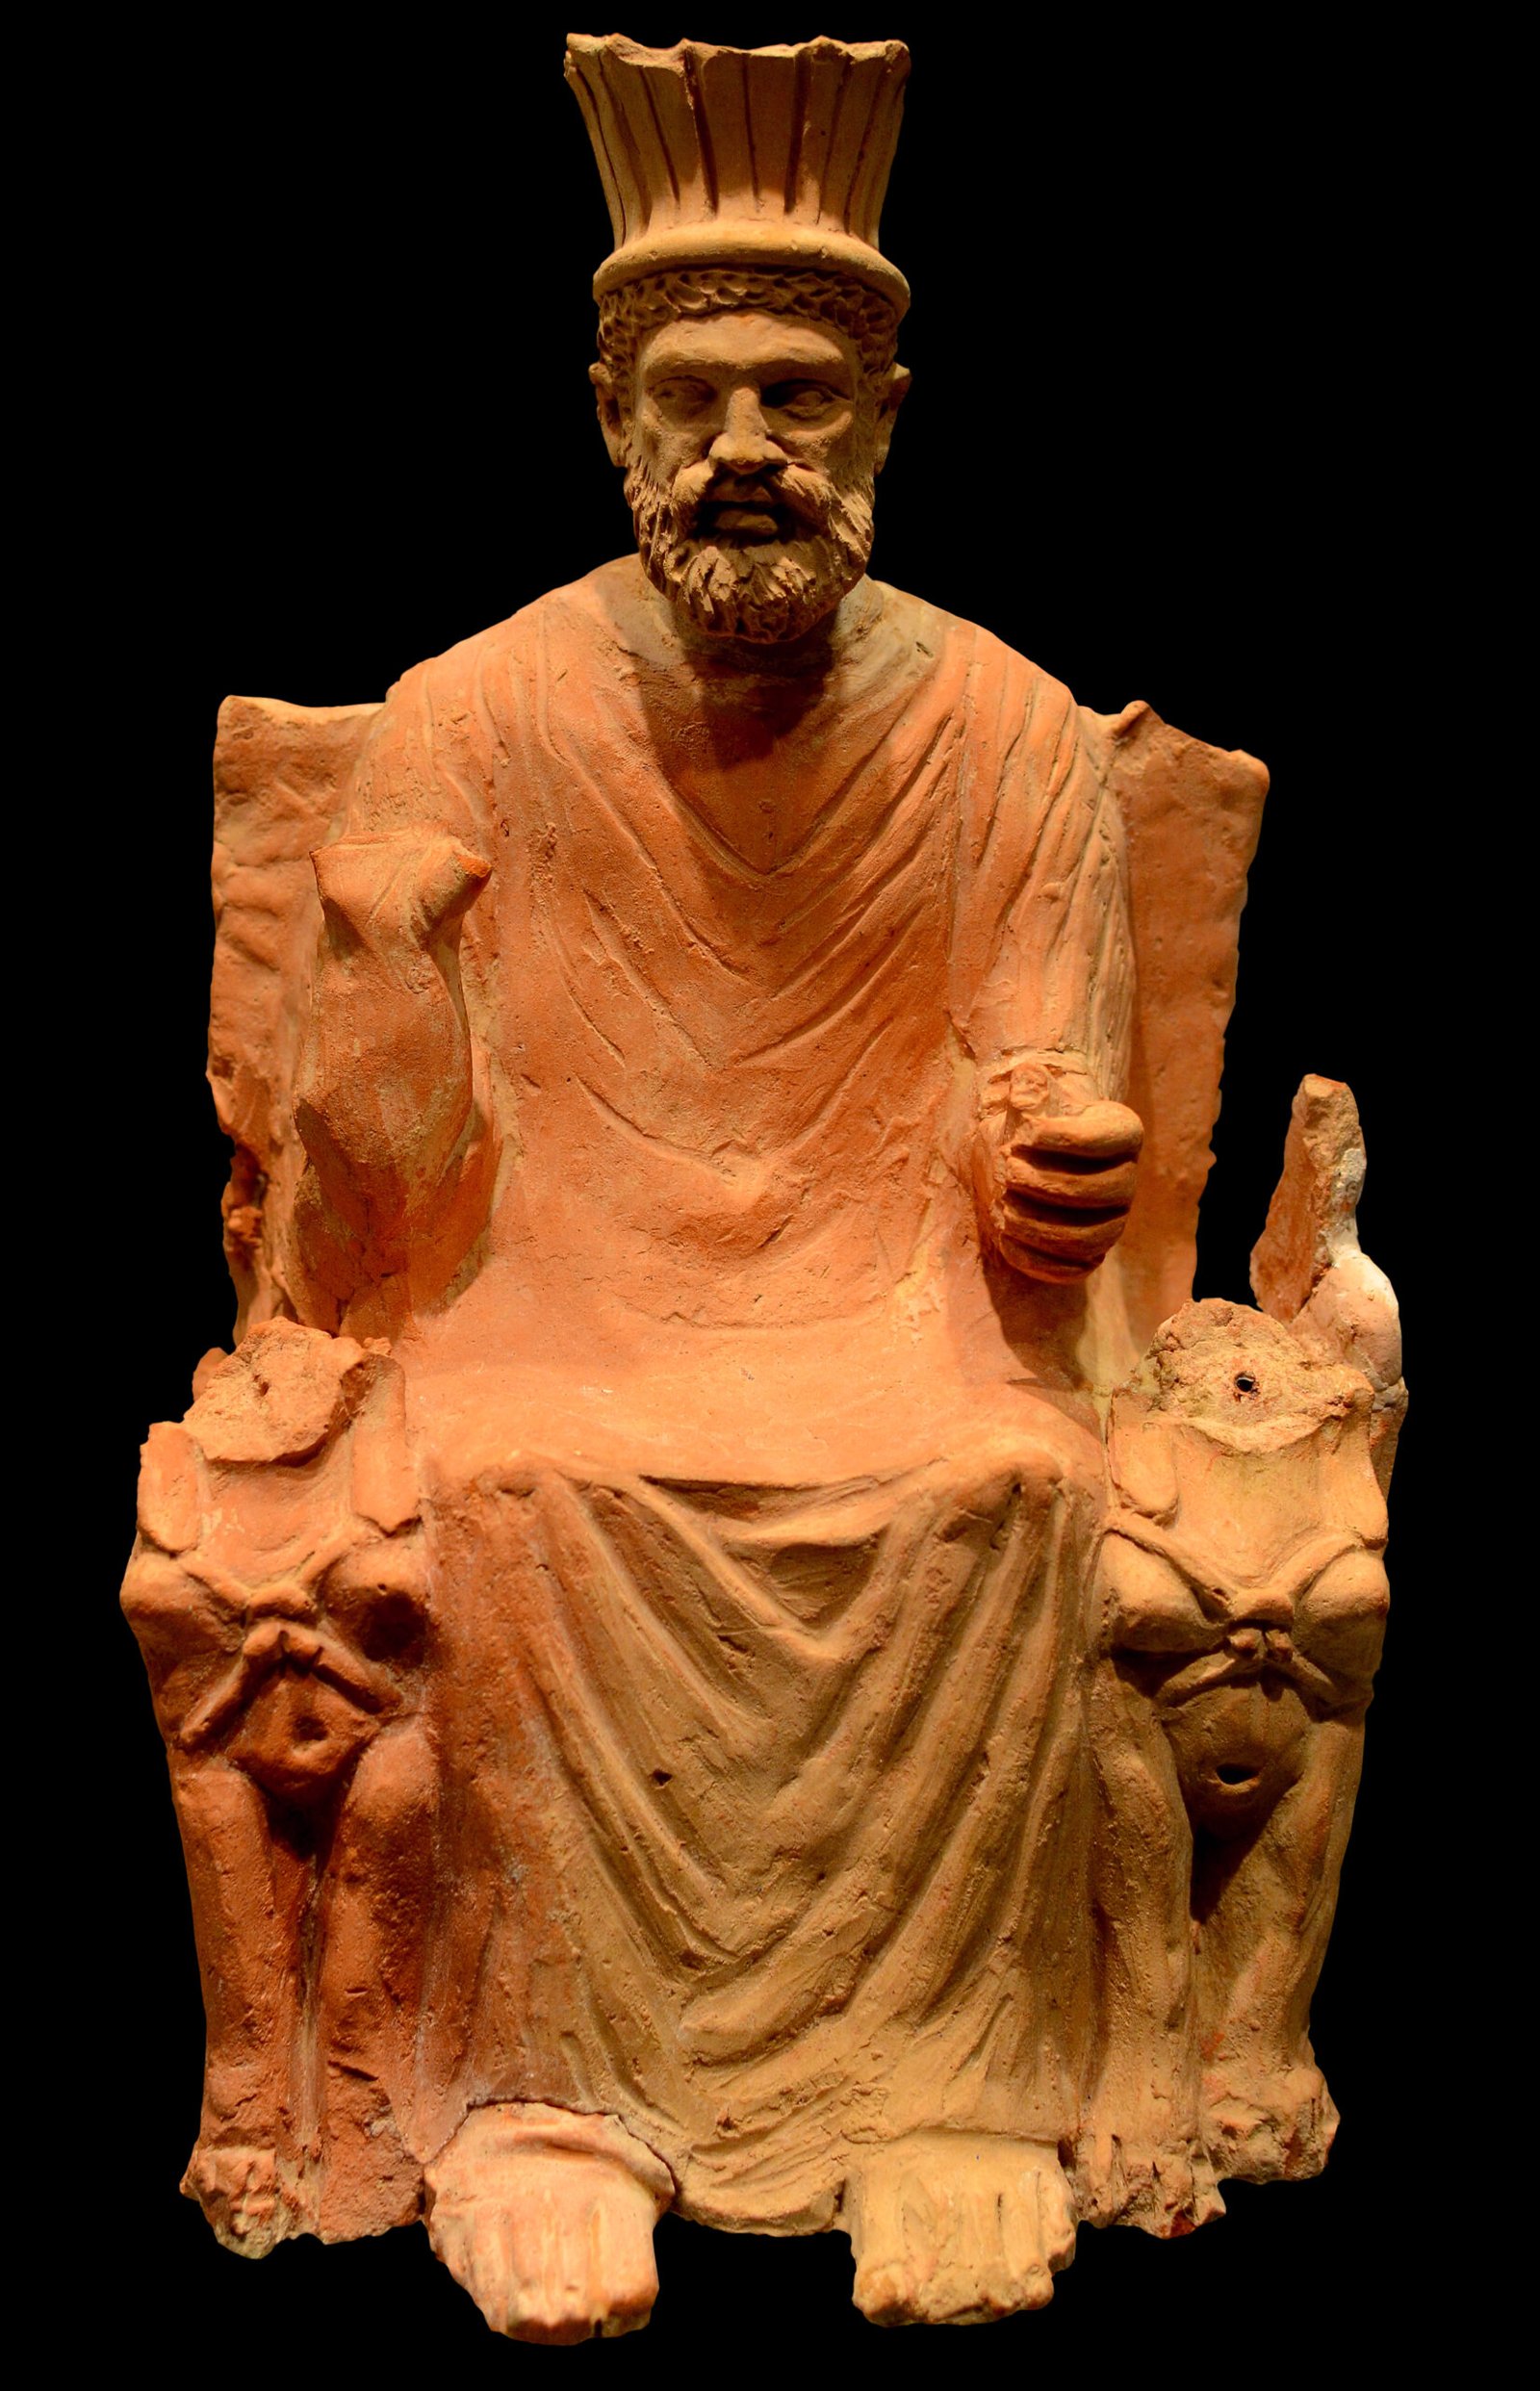
The Goddess Brigantia
Cartimandua was capable of such behaviour because she was a living representative of the goddess of sovereignty, Brigantia (Koch 1995:39-40; Ross 1996:354-355). According to Anne Ross, “Cartimandua’s powerful role in Roman times may suggest that society recognized the power of the goddess by mirroring her authority in its own temporal ruler. . . . This particular goddess may have been as much concerned with the actual tribal hegemony as with the territory” (Ross 1996:456). According to Patrick Ford, horses were intimately associated with goddesses of sovereignty (Ford 1977: 8-10). It is possible that Cartimandua inherited this role since her name literally means “sleek pony” (Ross 1996:449).
Brigantia was a goddess who manifested herself under three forms. If we can take her later manifestation in Ireland as a guide, Cormac’s Glossary tells us Brigantia represented first and foremost sovereignty, with her other two aspects representing healing and metal working (Byrne 1973; Ross 1996:456). Anne Ross further identifies Brigantia as a patroness of pastoral peoples in Ireland and Britain.12 The advent of Christianity did not abolish the role of Brigantia as a symbol of sovereignty. According to John Koch, “a further survival of this idea is seen in the fragmentary elegy to the 7th century Welsh king Cadwallon in which the River Braint (<*Briganti) is described as overflowing in grief for its fallen consort”.13